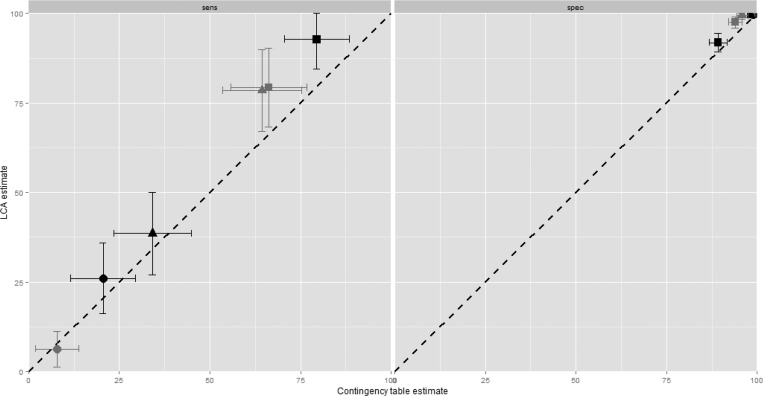
Figure 2.
Pairwise comparisons of the sensitivities (left) and specificities (right) of each test method estimated by traditional contingency table (x axes) or latent class analysis (LCA; y axes). Black = peripheral maternal blood; gray = placental blood; circle = microscopy, square = rapid diagnostic test (RDT), triangle = polymerase chain reaction (PCR). Lines are 95% confidence intervals of each point estimate. Contingency table estimates were computed using active placental histopathology as the reference standard.

