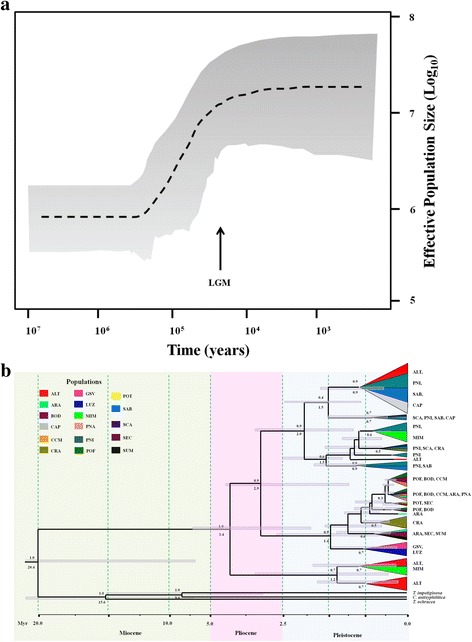
Fig. 2.

Demographical and evolutionary history of Tabebuia serratifolia lineages, based on concatenated sequences of cpDNA and ITS nrDNA. a Extended Bayesian Skyline Plot showing effective population size increase at c. 150 ka. b Coalescent tree showing that most lineage divergences occurred after the Lower Pleistocene. Tip section colour corresponds to population, following the figure legend. The section size corresponds to the number of haplotypes in each population in each clade. Grey bar corresponds to 95 % credibility interval of the mean time to the moat common ancestor; numbers above the branches are the support to the node (posterior probability); numbers below the branches are the node dating (time to the moat common ancestor). Time scale is in millions of years (Ma) before present
