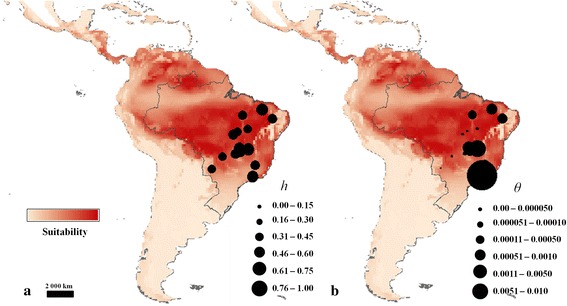
Fig. 4.

Spatial distribution of genetic diversity for ITS nuclear ribosomal DNA for Tabebuia serratifolia, in relation to the potential palaeodistribution at 21 ka. a Distribution of the haplotype diversity (h). b Distribution of the mutation parameter theta (θ). Circumference sizes are proportional to the value of genetic parameter, following the figure legends. The maps represent the consensus of the 60 models expressing the ensemble potential distribution for Tabebuia serratifolia, based on ecological niche modelling
