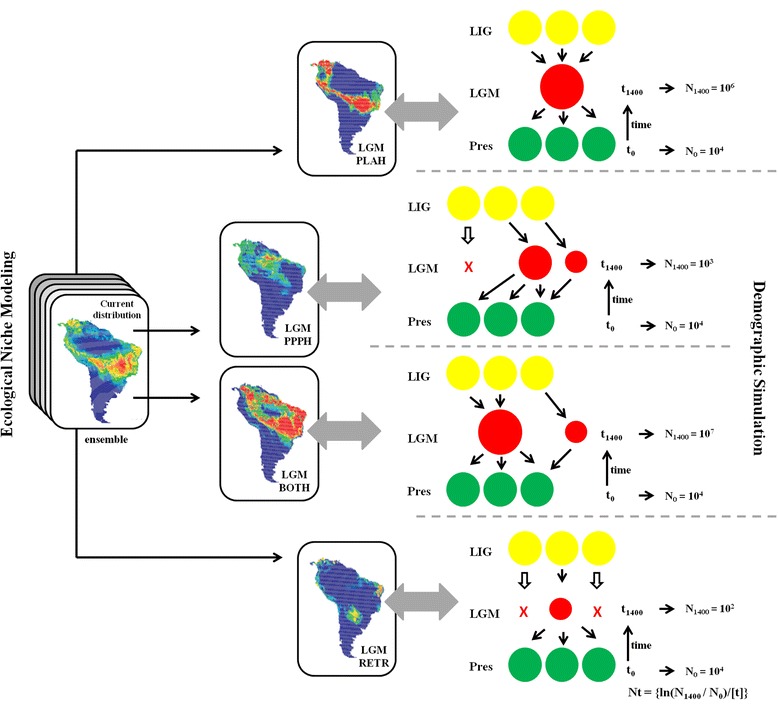
Fig. 5.

The demographical history scenarios simulated for Tabebuia serratifolia and their geographical representation. Circles represent the demes. The size and location of circle during the LGM indicate demographical population expansion or shrink, and geographical range shift at that time. LIG: last interglacial; LGM: last glacial maximum; Pres: present-day; N0: effective population size at time t0 (present); N1: effective population size at time t1400 (1,400 generations ago). The demographical scenarios correspond to: PLAH, Pleistocene Arc hypothesis; PPPH, the ‘Amazon SDF’ hypothesis; Both (PLAH + PPPH), i.e., an expansion throughout the Central and Southwest Brazil and also westward towards the Amazon Basin; Retraction, a retraction in geographical range in Central Brazil
