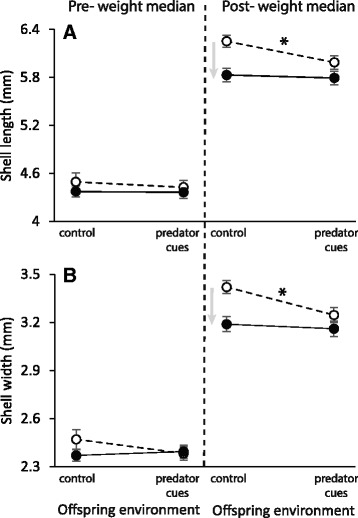
Fig. 3.

Reaction norms of offspring according to parental (E1) and offspring (E2) environments around the weight median for a) shell length and b) shell width. White circle and dashed line show reaction norms of offspring from control parental environment. Black circle and solid line show reaction norms of offspring from predator-cue parental environment. Significant TGP and WGP are showed by grey arrows and asterisk (*) respectively (Additional file 3). The overall relationships between shell length and shell width and weight of offspring phenotype (G2) according to parental and offspring environments are showed in Additional file 4
