
Fig. 4.
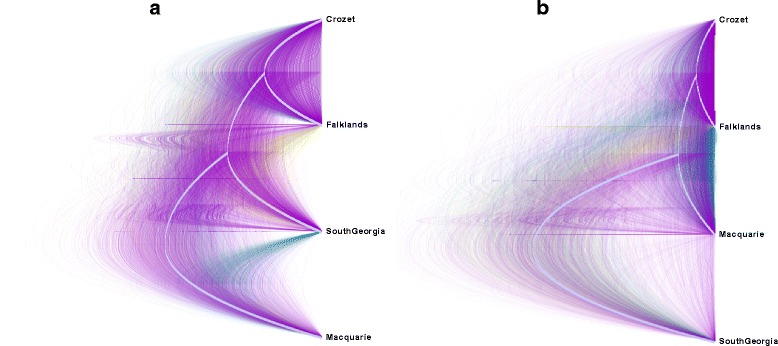
Evolutionary relationships among colonies. The full posterior distributions of trees from the SNAPP analyses, excluding a 10 % burn-in, are shown. The colours represent the different topologies; purple is the most highly supported, teal is the next most supported, and gold is the least supported. The consensus tree is shown in grey. (a) and (b) are the outcomes of the two different analyses with different randomly selected representative individuals