
Fig. 1.
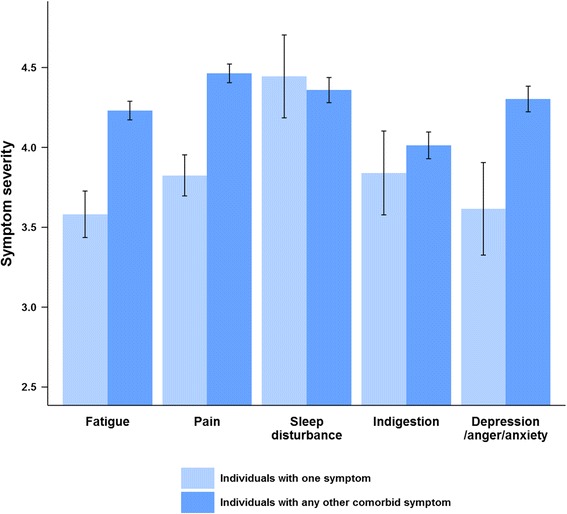
Severity of each symptom according to the presence of any other symptom. Light blue represents individuals with only one of the corresponding symptoms on the x-axis. Blue represents individuals with any other symptoms in the presence of the corresponding symptom. Symptom severity was assessed on a seven-point Likert scale ranging from one to seven