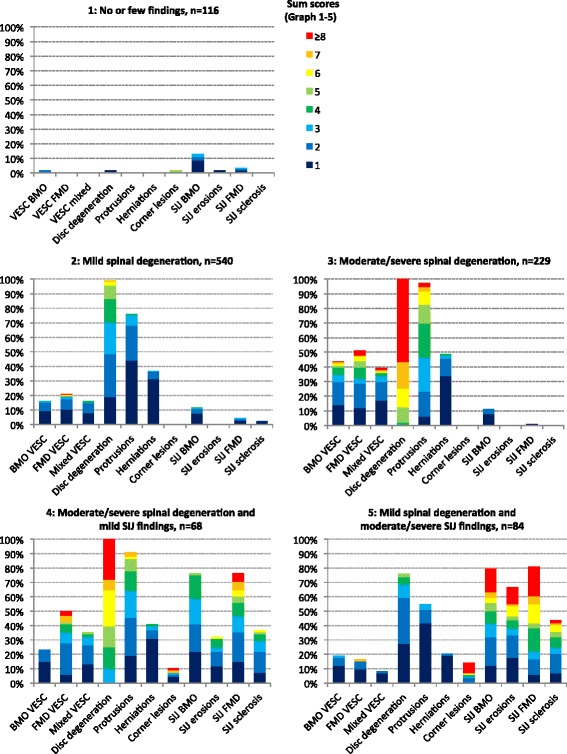
Fig. 2.

Prevalence of MRI findings in the five subgroups. Bar height represents the prevalence of patients with a given MRI finding. Bar colour reflects the sum scores for a given MRI finding as indicated. The sum scores reflect the cumulative ‘burden’ of a given MRI finding: sum scores for ‘VESC BMO’, ‘VESC FMD’, ‘VESC mixed’ and ‘corner lesions’ are the total number of lesions in all vertebral endplates; sum scores for ‘disc degeneration’ are the sum of an ordinal scale (0–3) reflecting the severity of lesions in all discs; and sum scores for ‘protrusions’ and ‘herniations’ are the total number of respective lesions in all discs. The four SIJ findings’ sum scores are the sum of ordinal scales (0–3) that reflect size of lesions at all SIJ regions. See Methods for details. BMO bone marrow oedema, VESC vertebral endplate signal changes, FMD fatty marrow deposition, SIJ sacroiliac joint (Colour figure online)
