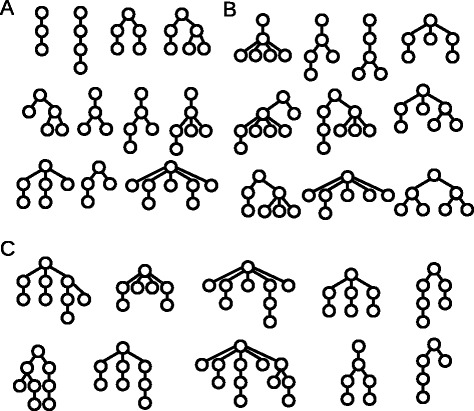
Fig. 7.

Examples for the clonal architecture detected in leukemic patients and simulations. Each tree corresponds to one patient. a Clonal hierarchies detected in patients from [12] and in simulations. b Clonal hierarchies detected in simulations but not in patients from [12]. c Clonal hierarchies detected in patients from [12] but not in simulations. The reconstruction of the clonal architecture from genetic measurements is not always unique. In case of ambiguity only one possibility is shown in the figure. Parameters were set as specified in the caption of Fig. 6
