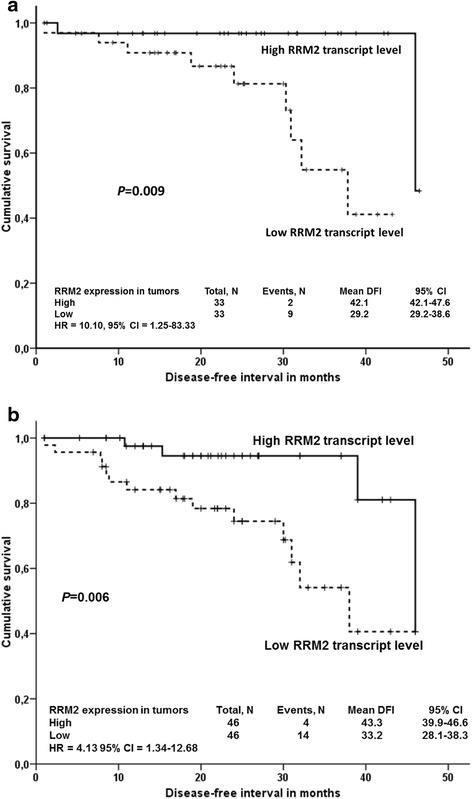
Fig. 2.

Association between RRM2 transcript levels and DFI of colorectal cancer patients. Kaplan-Meier survival curves were plotted for patients (n = 66, one patient was lost to follow up) from the validation set I (a) or combined testing and validation I sets (n = 92) (b). Patients were divided into two groups according to the median of transcript levels in tumors. Dashed line represents the group with lower transcript levels, solid line the group with higher transcript levels than median. Differences between groups were compared using Log-rank test. All genes have been analyzed, but to retain concise style only significant association is reported. HR = hazard ratio, 95 % CI = 95 % confidence intervals for stage-adjusted analyses
