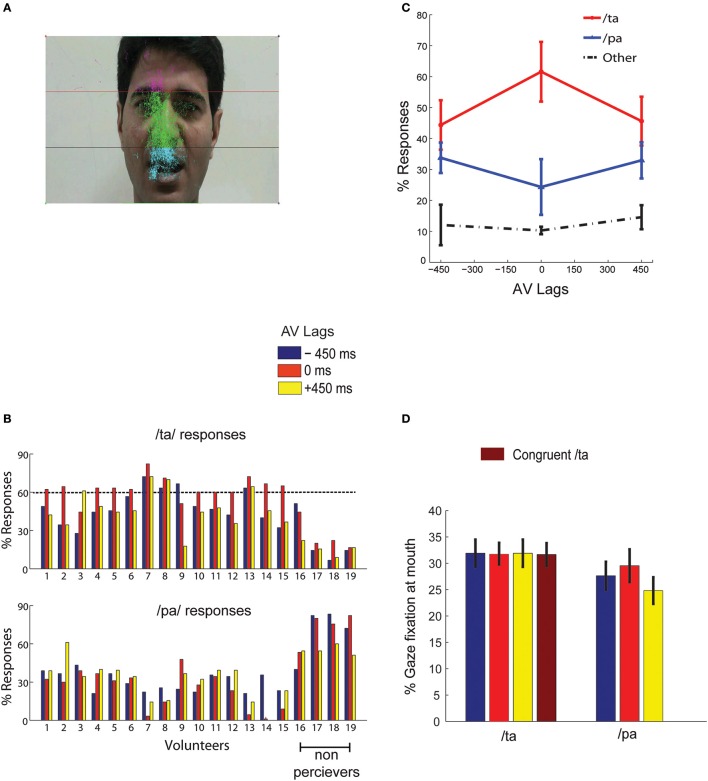
Figure 2.
Behavior (A) overall eye gaze fixation overlaid over a single frame of the stimuli (B) the bar graphs show the percentage of /ta/ and /pa/ responses for each subject at the AV lags:−450, 0, +450 ms as indicated by the colors guide (C) shows the number of normalized group responses in each of the three perceptual categories: “/pa/”, “/ta/”, and “other” for each AV lag. The error bars represent the 95% confidence interval (D) Mean gaze fixation percentages at mouth for each perceptual category at the respective stimuli (incongruent AV lags −450, 0, +450 ms, and congruent /ta/) across trials and participants. The error bars represents 95% confidence interval. /pa/ perception for congruent /ta/ stimulus were less than < 1%.

