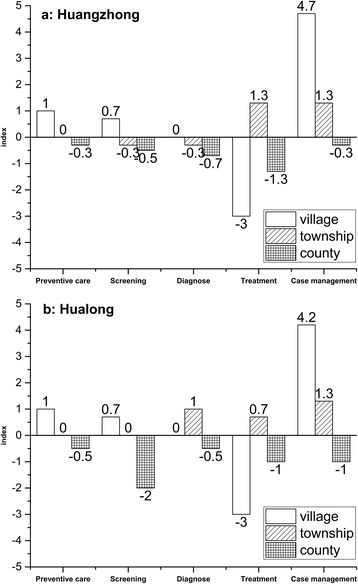
Fig. 4.

Pannel a shows gaps and over-provisions of six types interventions related to diabetes provided by different levels in Huangzhong, while pannel b shows that in Hualong. The horizontal axis represents the type of interventions. The vertial axis represents gap index (below 0.0) and over-provision index (above 0.0). Bars in different formats represent different institutional levels
