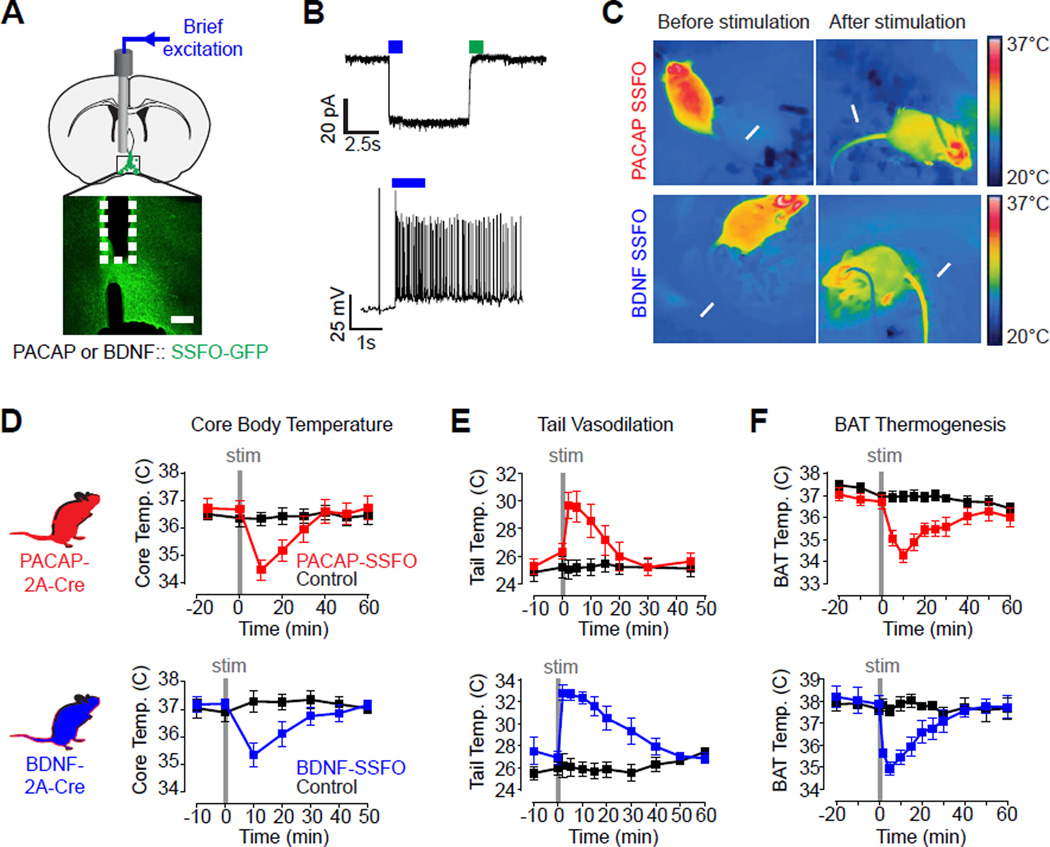
Figure 3. Optogenetic activation of VMPOPACAP/BDNF neurons induces hypothermia.
See also Figure S3.
(A) Schematic and representative slice showing placement of optical fiber above VMPOPACAP/BDNF neurons expressing SSFO-eYFP (green). Scale bar = 100 µm.
(B) Representative patch-clamp recording trace showing light-induced photocurrent (top) and action potentials (bottom) in VMPOPACAP/BDNF neurons expressing SSFO.
(C) Infrared thermography shows tail vasodilation (arrow) and trunk temperature loss upon VMPOPACAP/BDNF neurons stimulation.
(D–F) Stimulation (2 Hz, 30 s) of VMPOPACAP (red) or VMPOBDNF (blue) neurons induced
(D) transient rectal temperature hypothermia. n=4–7 per group, F7,84 (PACAP)=15.43, P<0.001; F6,48 (BDNF)=16.16, P<0.001;
(E) increased tail base temperature. n=7–9 per group, F8,120 (PACAP)=11.43, P<0.001; F7,84(BDNF)=14.78, P<0.001;
(F) reduced subcutaneous temperature in the interscapular brown fat deposit. n=5–10 per group, F10,160 (PACAP)=13.11, P<0.001; F9,72 (BDNF)=6.70, P<0.001. All F statistic show two-way RM-ANOVA, Group × Time Interaction.

