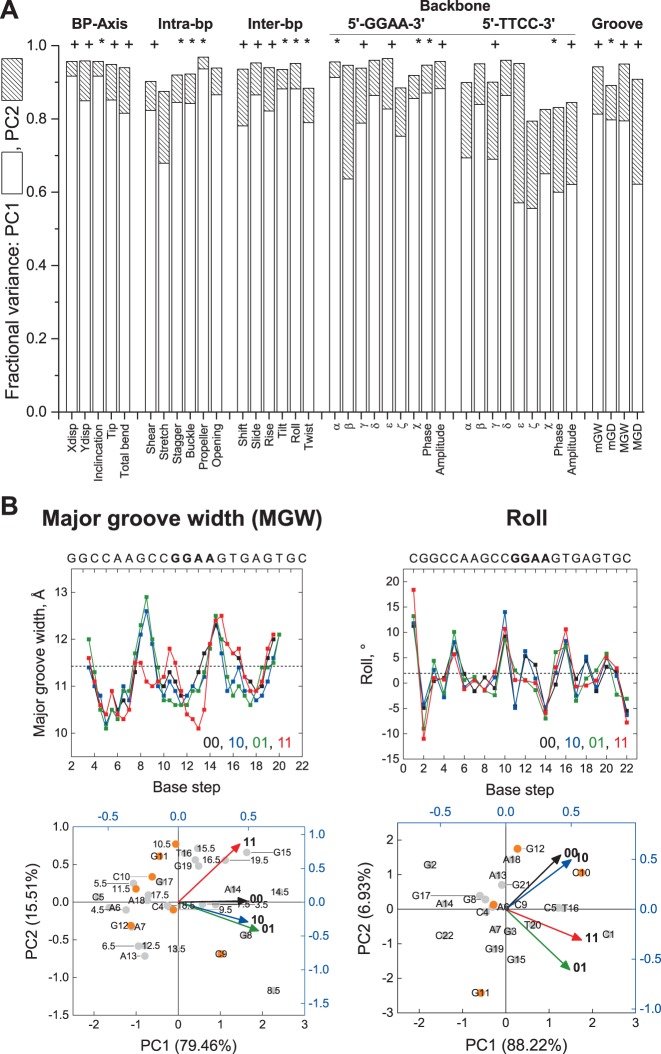
Figure 5.
Principal component analysis (PCA) of simulated un-, hemi-, and fully methylated structures of a CpG-containing ETS-binding site. The energy-minimized structures of the experimental SC1 sequence (cf. Figure 4) were analyzed by PCA as described in Materials and Methods. (A) Summed fractional variance of the first and second principal components for the 39 helical parameters. To assess the relative significance of the principal components (PCs), Bartlett's test was performed to identify parameters for which PC3 and PC4 (+), or PC2 to PC4 (*), were not significantly different; parameters whose four PCs were all significantly different were unmarked (all P < 0.05). (B) Major groove width (MGW) and roll, as representative parameters for which the fully methylated site was uncorrelated and correlated with either of the hemi-methylated sequence, respectively (cf. Table 2). Top: Variation in the parameters along the DNA sequence (00: unmethylated; 10: forward hemi-methylated; 01: reverse hemi-methylated; 11: fully methylated). Bottom: biplots scoring each base step (half step in the case of MGW) as points on principal component axes (% of the total variance in parenthesis), and each methylation state as vectors. To disperse the data, the points and vectors are plotted on different scales, and the CpG nucleotide (C10, G11) plus its nearest neighbors (C9, G12) are highlighted in orange (numbers denote position along the DNA sequence). Note the general lack of clustering of positions proximal to the CpG nucleotide with the methylation states, reflecting delocalized heterogeneity in the conformation of the four structures.

