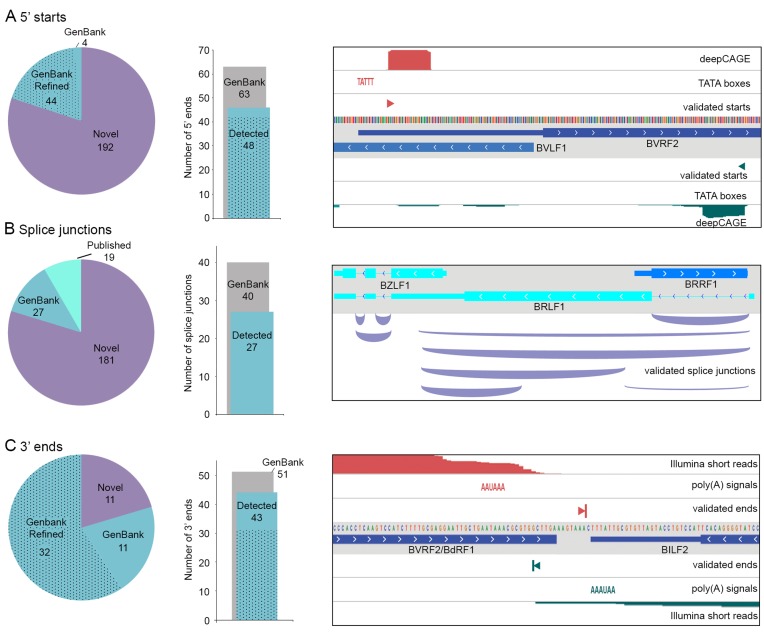
Figure 2.
Validation of transcript features. (A) Validation of 5′ starts. Pie chart indicates annotation status of validated 5′ starts. ‘Refined’ includes start sites annotated at TATA boxes that are more accurately identified in this study. Bar chart indicates the number of GenBank-annotated 5′ starts validated in this study (stippled = refined). Genome browser panel shows example validated 5′ starts. (B) Validation of splice junctions. Pie chart indicates annotation status of validated splice junctions. Bar chart indicates the number of GenBank-annotated splice junctions validated in this study. Genome browser panel shows example validated splice junctions. (C) Validation of 3′ ends. Pie chart indicates annotation status of validated 3′ ends. ‘Refined’ includes end sites annotated at canonical polyadenylation signals that are more accurately identified in this study. Bar chart indicates the number of GenBank-annotated 3′ ends validated in this study (stippled = refined). Genome browser panel shows example validated 3′ ends.

