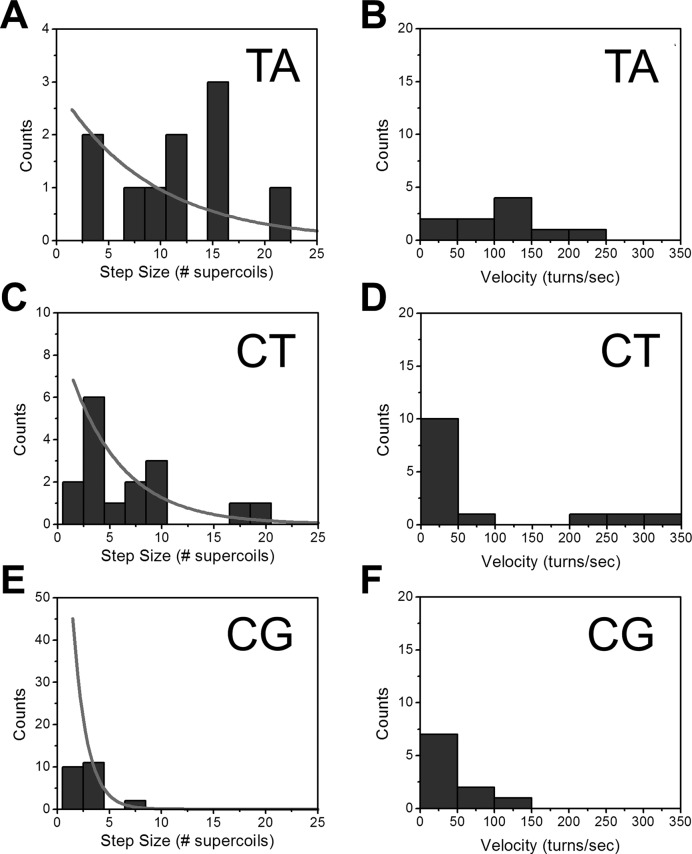
Figure 5.
Step size and rotational velocity distributions. For the three attB sequence oligos studied (A, B: attB.TA; C, D; attB.CT; E, F: attB.CG), the distributions of step sizes and step velocities are shown (solid dark gray bars). Step size distributions bins have width 2, and are centered at n = 1.5, 2.5,… . With increasing base pairing stability the widths of the step size and the velocity distributions are both gradually reduced. The n > 2 step-size distributions are consistent with the controlled rotation model (solid gray curves in A, C, E), except in the leftmost bin (n = 1 and 2), corresponding to events obscured by Brownian noise.

