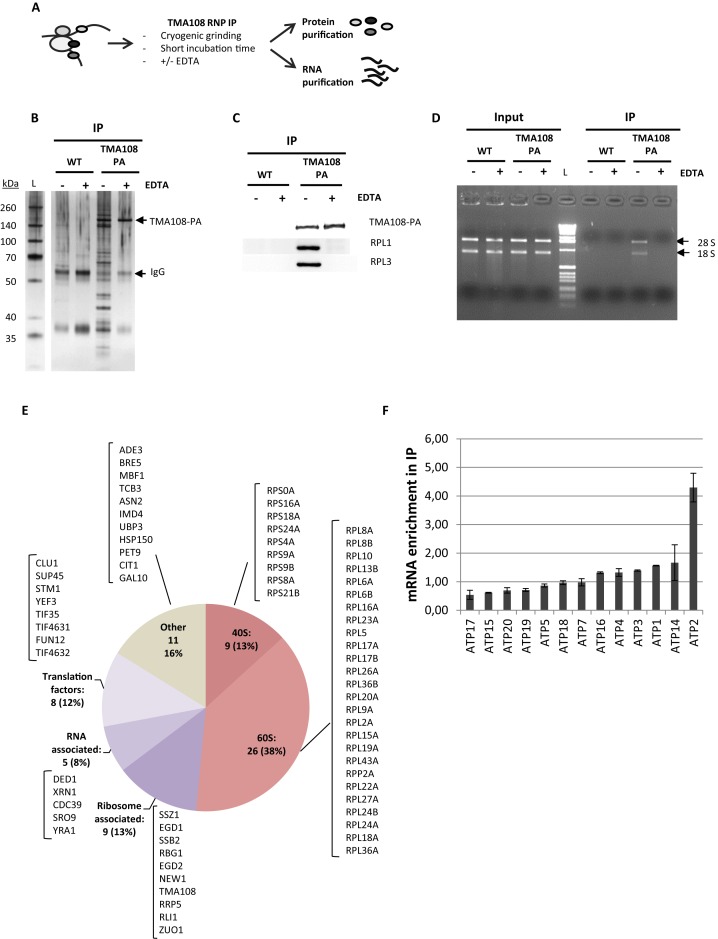
Figure 2.
Tma108 interacts with translating ribosomes that are associated with ATP2 mRNA. (A) Experimental approach. Immunoprecipitations were performed on cells grown on rich medium, expressing Tma108-PA and untagged cells (WT) in presence (+) or in absence (−) of 40 mM EDTA. Protein (B, C and E) and RNA (D,F) contents were analyzed from total extract (Input) and immunoprecipitated samples (IP). (B) Input and immunoprecipitated fractions obtained from untagged or Tma108-PA expressing-cells were analyzed by SDS-PAGE followed by silver staining. The position of the Tma108-PA fusion and IgG are indicated. (C) Input and immunoprecipitated fractions obtained from untagged or Tma108-PA expressing-cells were analyzed by SDS-PAGE followed by western-blots using antibodies directed to ribosomal proteins (Rpl1, Rpl3). (D) Following RNA isolation, input and immunoprecipitated fractions obtained from untagged or Tma108-PA expressing-cells were analyzed by agarose gel electrophoresis with ethidium bromide staining (L: 1kb DNA ladder biolabs). The bands corresponding to 28S and 18S rRNA are indicated. (E) Diagram showing the functional distribution of proteins detected by mass spectrometry analysis of Tma108-PA IP in the absence of EDTA. The names of the proteins included in the different sectors are indicated (see Supplementary Table S6). Only proteins reproducibly detected with a MS score superior to the threshold determined with the untagged sample were selected (see Supplementary Figure S1). Most of these proteins are lost when IP are performed in the presence of EDTA (see Figure 5B). (F) Real-time PCR analysis of mRNA immunoprecipitated with Tma108-PA IP. For each analyzed mRNA, the enrichment factor corresponds to the ratio IP/Input normalized using a set of control mRNA (Act1,Trx2,Tpm2,Jen1,Flr1). After normalization, the mean enrichment factor for the control mRNA set is equal to 1. When EDTA is added in the IP, ATP2 mRNA is no longer enriched compared to the other mRNA (see Figure 5B). No specific enrichment of ATP2 mRNA is detected when analyzing IP performed with the untagged strain (data not shown).

