Figure 3.
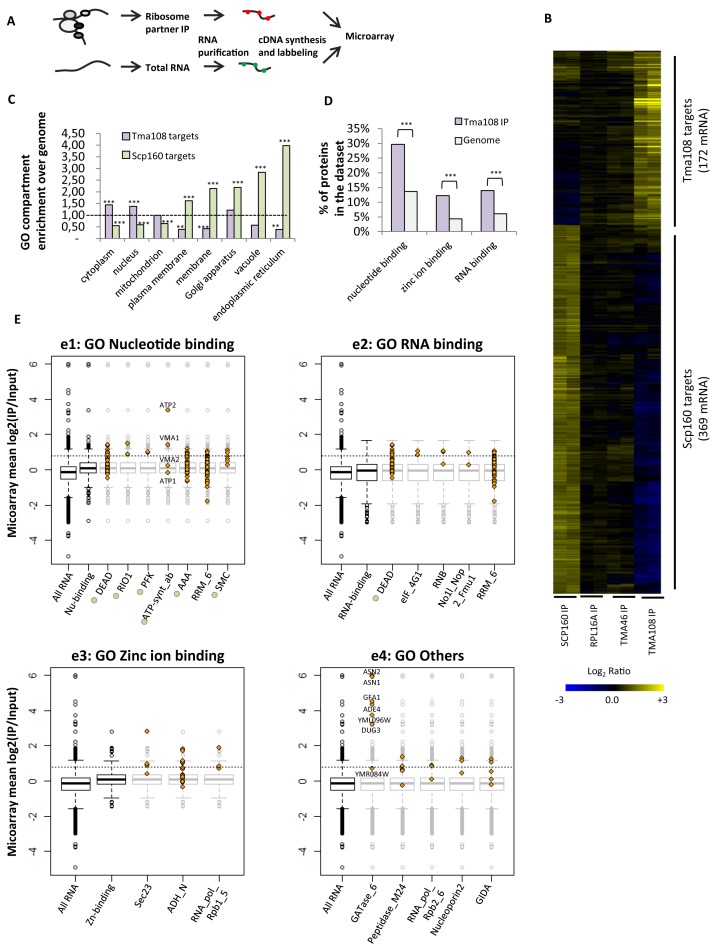
Tma108 targets ribosome translating a subset of the cellular mRNA. (A) Strategy developed to identify mRNA specifically enriched with factors associated with translating ribosomes. Immunoprecipitations were performed from cells expressing proteinA tagged versions of Tma108, Scp160 or Tma46. As a control, the whole set of ribosomes was immunoprecipitated using cells expressing a tagged version of Rpl16a. (B) Hierarchically clustered heat map showed IP/input log2(ratios) for mRNA enriched with at least one of the tested ribosomal partners in two independent experiments (Supplementary Tables S7 and S8). Each line represents an experiment, each column a gene. (C) Analysis of over-enrichment and under-enrichment of GO terms (cellular component) among Tma108 and Scp160 mRNA targets (Supplementary Table S9). The extent of the enrichment for each GO term is expressed as a fold enrichment over genome. Significant over- and under-enrichments are indicated (***P-value < 10−3, **P-value < 5 × 10⁻²). (D) Tma108 targets are highly enriched in defined molecular functions. Analysis of enrichment of the GO terms revealed three main categories of over-represented functions: Nucleotide binding (P-value: 2.3 × 10⁻⁸), Zinc ion binding (P-value: 1.5 × 10⁻⁵) and RNA binding (P-value: 9.7 × 10⁻⁵). Over-represented functional categories included in these three GO terms are not represented (Supplementary Table S10). (E) Analysis of Pfam domains over-represented in proteins encoded by Tma108 targets. Eighteen Pfam domains that showed a significant enrichment (P-value < 0.05) in Tma108 dataset were selected (identifiers and P-value in Supplementary Table S11). They were classified according to their belonging to the different GO terms (function) enriched in Tma108 list (e1: Nucleotide binding, e2: RNA binding, e3:Zinc ion binding, e4: Others). The boxplots represent the distribution of mean log2(IP/Input) values obtained in microarray analyses of Tma108 immunoprecipitation for the whole cellular mRNA and for the analyzed GO categories. For each Pfam domain, the values of log2(IP/Input) measured for each individual gene included in the Pfam dataset are plotted (yellow diamond) overlapped on the boxplot (light gray) of the corresponding GO term (e1–3) or of the total RNA dataset (e4). Pfam domains indicated with green circles correspond to domains with ATPase activity. Dashed lines correspond to the 0.8 threshold that was chosen to determine Tma108 targets.

