Figure 5.
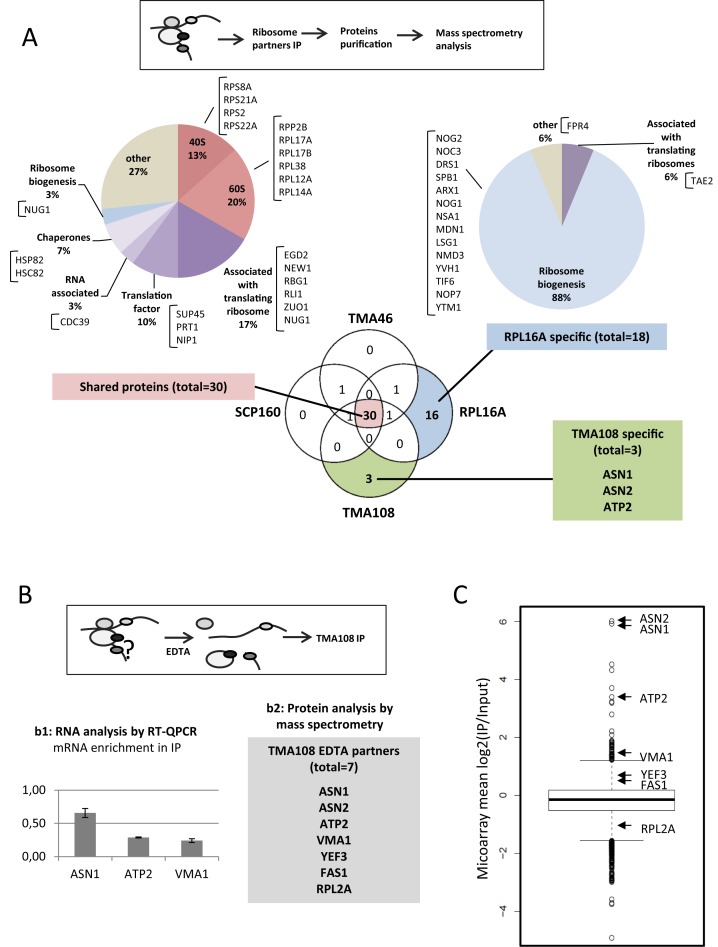
Tma108 directly interacts with proteins encoded by its associated translating complexes. (A) Comparison of the composition of Tma108, Scp160 and Tma46-associated ribosomes with the composition of canonical (Rpl16A-associated) ribosomes. Experimental strategy (top panel). Immunoprecipitations of proteinA-tagged versions of Tma108, Scp160, Tma46 or Rpl16a were followed by mass spectrometry analysis of their protein partners. Venn Diagramm represents the overlap of the four different sets of co-immunoprecipitated proteins: in each sector the number of interactants reproducibly detected in two independent experiments is indicated (Supplementary Table S12). Chart pies show the functional distribution of proteins for shared and Rpl16a specific dataset. The names of the proteins included in the different sectors are indicated. The 3 proteins specifically detected in Tma108 IP are also indicated. (B) Analysis of Tma108 partners following ribosome dissociation with EDTA. Experimental strategy (top panel) used to identify Tma108 interacting partners. Immunoprecipitations (n = 2) were performed on cells expressing Tma108-PA in the presence of 40 mM EDTA (see Figure 2B–D). RNAs (b1) were analyzed by real-time PCR. For each analyzed mRNA, the enrichment factor corresponds to the ratio IP/Input normalized using a set of control mRNA (Act1, Trx2, Jen1, Flr1). Mass spectrometry analysis (b2) of proteins co-immunoprecipitated with Tma108 in the presence of EDTA: only seven proteins were reproducibly detected in that condition. (C) Most of the Tma108-specific proteins partners are translated by Tma108-associated ribosomes. The boxplot represents the distribution of mean log2(IP/Input) values obtained following microarray analysis of Tma108-associated mRNAs (in the absence of EDTA). Arrows point the values for the mRNAs corresponding to the proteins that were detected as specific Tma108 partners (Figure 5B, panel 2).

