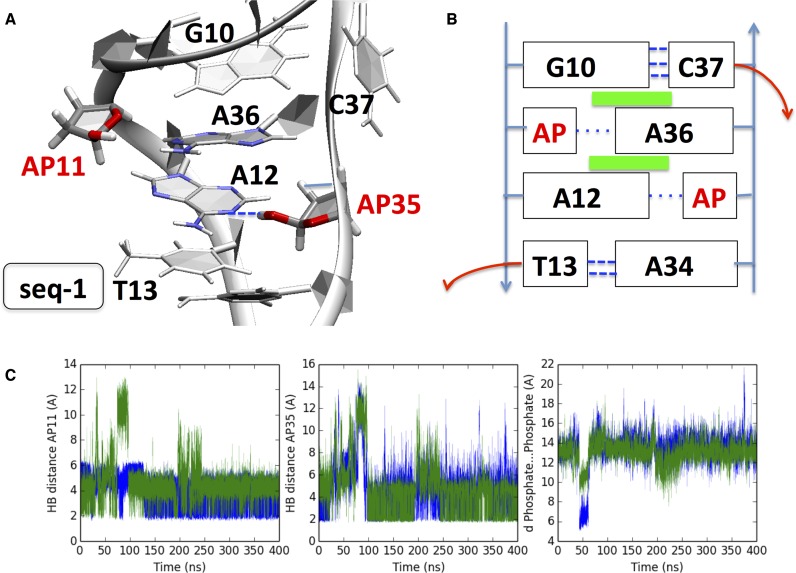
Figure 3.
(A) Cartoon representation of the final structure obtained after 400 ns for seq-1. (B) Diagram showing the interaction pattern: Green rectangles indicate transverse π-stacking, and dashed blue lines new hydrogen bonds (thick ones for Watson–Crick pairing). (C) Left panel: blue line AP11H1…AP11O5′ distance, green line AP11H1…A36N1. Middle panel: blue line AP35H1…A12N1distance, green line AP35H1…A34N3 distance. Right panel: blue line A12P…C37P distance, green line T13P…A36P; see also Supplementary Figure S5 for explicative diagrams. The two AP sites are mostly directed within the helix, owing to HB with vicinal nucleobases: the cytosine C37 adopts an extrahelical position. A36 develops interstrand stacking with G10 and A12.

