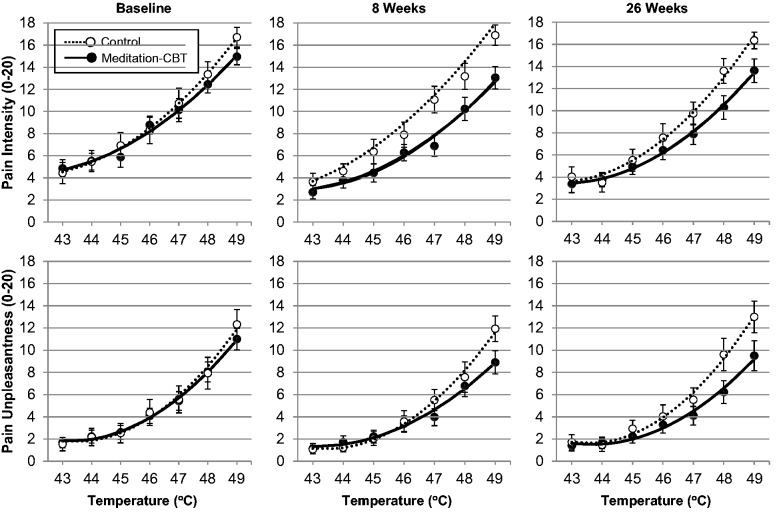
Figure 3.
Comparison of average pain intensity and unpleasantness ratings of thermal stimuli between meditation-CBT (N = 20) and control (N = 14) participants at baseline, 8, and 26 weeks. The lines represent the average estimate of quadratic function for the relationship between stimulus temperatures and pain ratings; the markers represent the average pain rating at each temperature with error bars for the standard error of the mean (SEM). Significant differences between the groups for the slope of the quadratic function were observed for pain intensity and unpleasantness ratings at both 8 and 26 weeks (P < 0.05).

