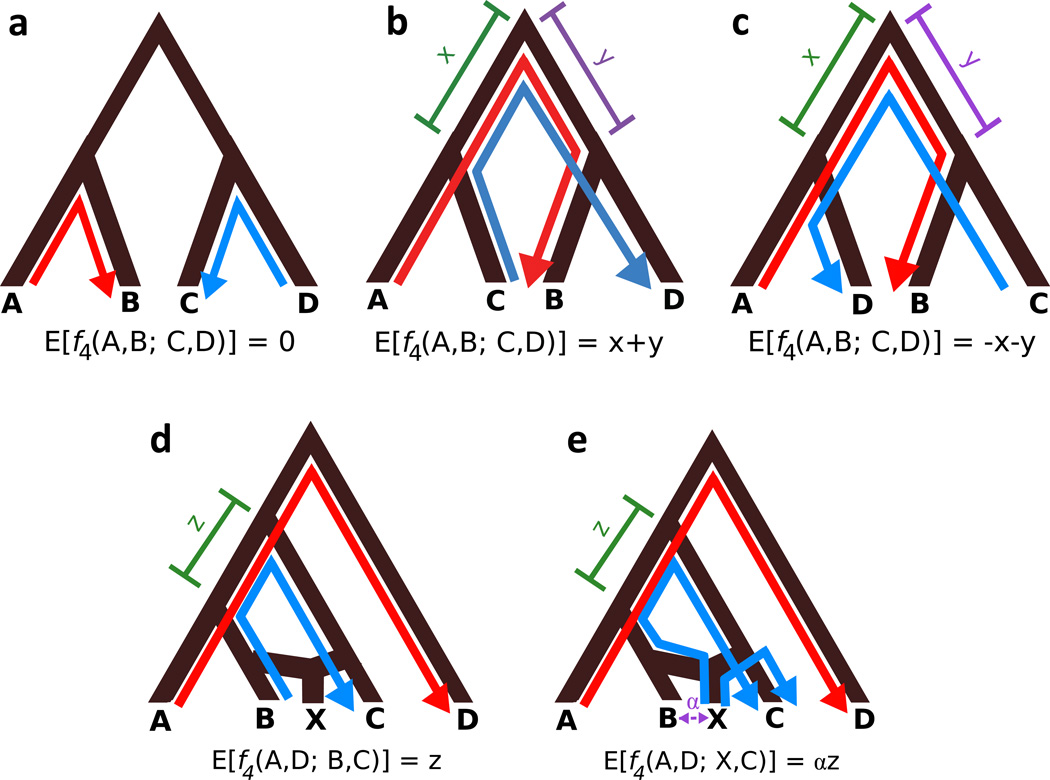
Figure 4.
Adapted from (Reich et al. 2009). Visual explanation of expected values of f4(A, B; C, D) under various tree topologies. Red lines trace genetic drift from A to B; blue lines trace drift from C to D. f4 measures drift shared between A and B that is also shared between C and D. Drift is shared along branches where arrows overlap going in the same direction. a–c: Positive, negative, and zero values of f4 give support for different tree topologies relating the four populations. d, e: visual explanation of f4 ratio method for inferring admixture proportion. Population X is a mixture of populations related to B and C; population D is an outgroup. The quantity of interest, α, is the proportion of ancestry population X has received from B. If the expected value of f4(A, D; B, C) = z (d), then the expected value of f4(A, D; X, C) = αz (e). It follows that α = f4(A, D; B, C)/f4(A, D; X, C) (Patterson et al. 2012).

