Fig. 8.
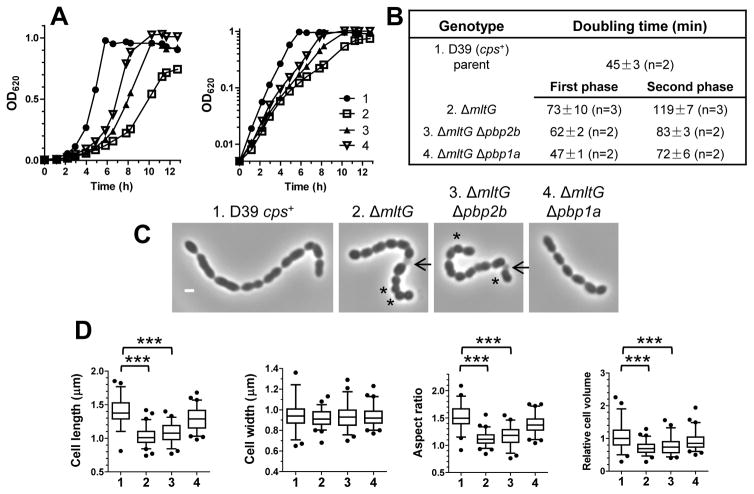
Impaired growth and spherical cell shape of encapsulated D39 ΔmltG pbp1a+ strains (A) Representative growth curves of IU1690 (1, D39 cps+ wild-type parent); IU9771 (2, cps+ ΔmltG); IU9897 (3, cps+ ΔmltG Δpbp2b); and IU10021 (4, cps+ ΔmltG Δpbp1a). Strains were inoculated from ice stocks, grown in BHI broth for 11h, and diluted to OD620 ≈0.005 in BHI broth to tart growth cultures (see Experimental procedures). (B) Doubling times (mean ± SEM) of the above strains obtained from at least two independent experiments. IU9771, IU9897 and IU10021 grow biphasically with a change to a slower growth rate at OD620 = 0.05 to 0.1. (C) Representaive phase-contrast images taken at OD620 ≈0.1 to 0.15. Particularly spherical or lysed cells are marked by astericks (*) or arrows, respectively. Micrographs are at the same magnification (scale bar = 1 μm). (D) Box-and-whisker plots (whiskers, 5 and 95 percentile) of cell lengths, widths, aspect ratios (length to width ratio), and relative volumes. Fifty or more cells from two independent experiments were measured as described in Experimental procedures for each strain. P values were obtained by one-way ANOVA analysis (GraphPad Prism, nonparametric Kruskal-Wallis test). *** denotes p<0.001. Only comparisons of mutant strains with the parent strain are shown. Comparisons that are not significantly different are not marked by brackets.

