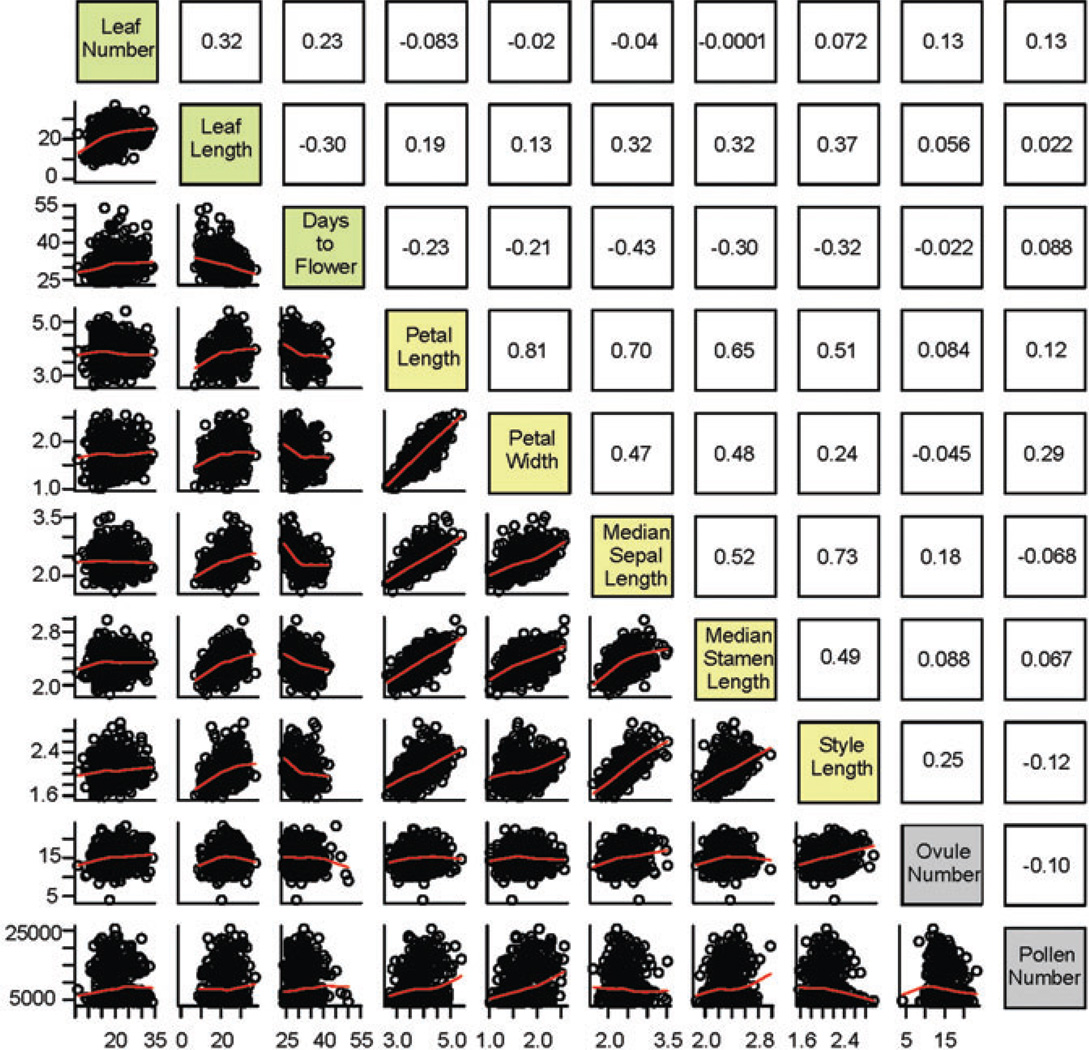
Figure 3.
Character correlations in the F2 population. Scatterplots of all pairs of traits are given below the diagonal and Spearman’s correlation coefficients are given above the diagonal. Traits are color-coded with green for vegetative and phenology traits, yellow for floral traits and grey for reproductive traits.

