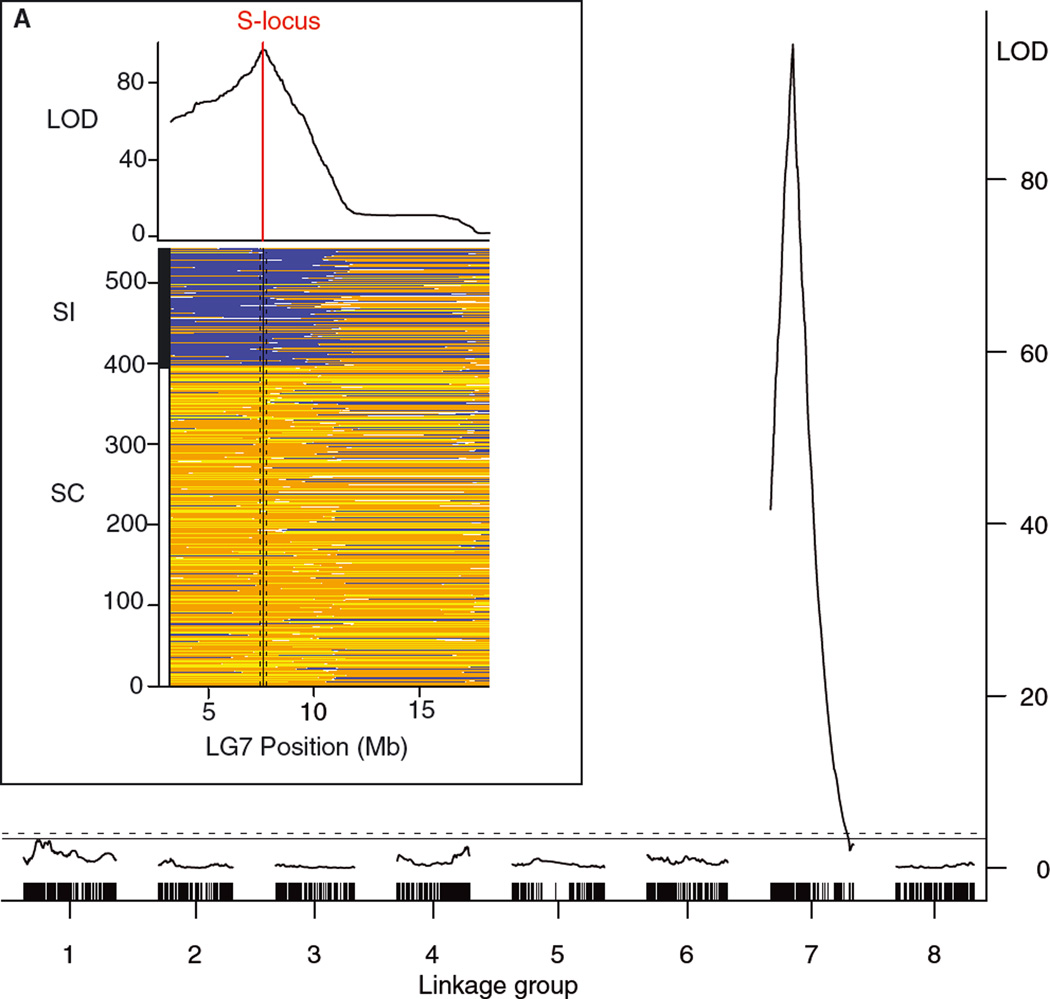
Figure 5.
Fine-mapping of QTL for self-incompatibility on LG7. The large figure shows the LOD profile resulting from interval mapping of SI with hard genotype calls, and the inset shows the fine-scale location of the QTL to a region of LG7 containing the S locus, as well as the ancestry probabilities for each individual across LG7, sorted by self-incompatibility status (SI: self-incompatible, SC: self-compatible). For each individual, a blue bar indicates high probability (>0.9) that the region is homozygous for the Capsella grandiflora allele, a yellow bar indicates high probability that the region is homozygous for the C. rubella allele and an orange bar indicates high probability of heterozygosity.

