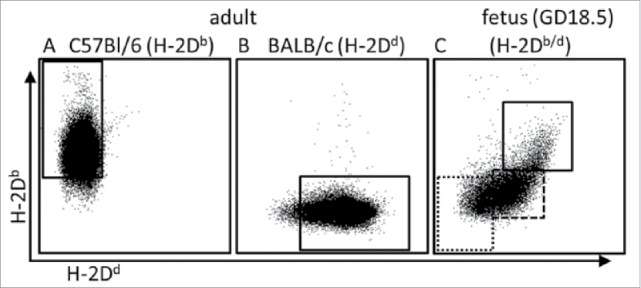
Figure 3.

H-2D expression on adult and fetal bone marrow cells. Representative examples for frequencies of respective H-2D-positive cells among maternal (H-2Db, marked by the solid gate in (A), paternal (H-2Dd, marked by the solid gate in (B) and fetal (H-2Db/d, marked by the solid gate in (C) CD45+ BM-derived leukocytes. Fetal cells were obtained from offspring according to the mating combination shown in Figure 1. Note that a gradient ranging from H-2Db/d high expression (solid square in (C) to H-2Db/d dim expression (marked by stippled gate) and H-2Db/d negativity (marked by dotted gate) was observed among the fetal leukocytes.
