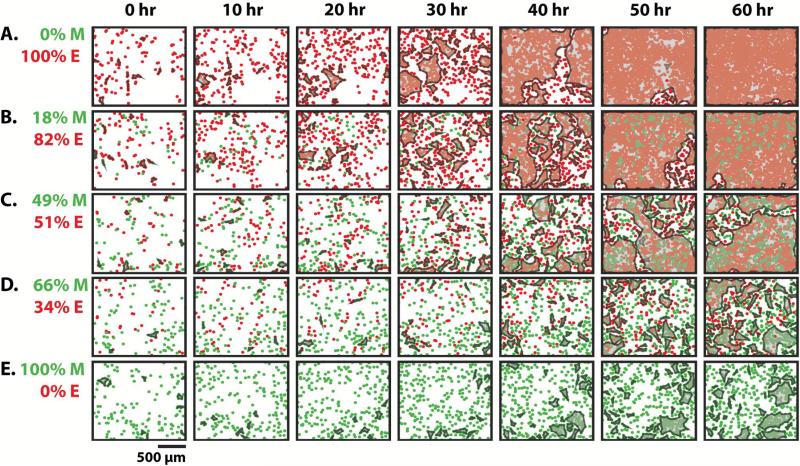
Figure 1.
Representative snapshots of epithelial and mesenchymal cells mixed in varying ratios over time. Cell density increased over time (left to right). As the initial percentage of mesenchymal cells increased, the formation of clusters occurred with slower kinetics and smaller sizes (top to bottom). Mixtures shown by increasing mesenchymal percentage are 0% (A), 18% (B), 49% (C), 66% (D) and 100% (E).

