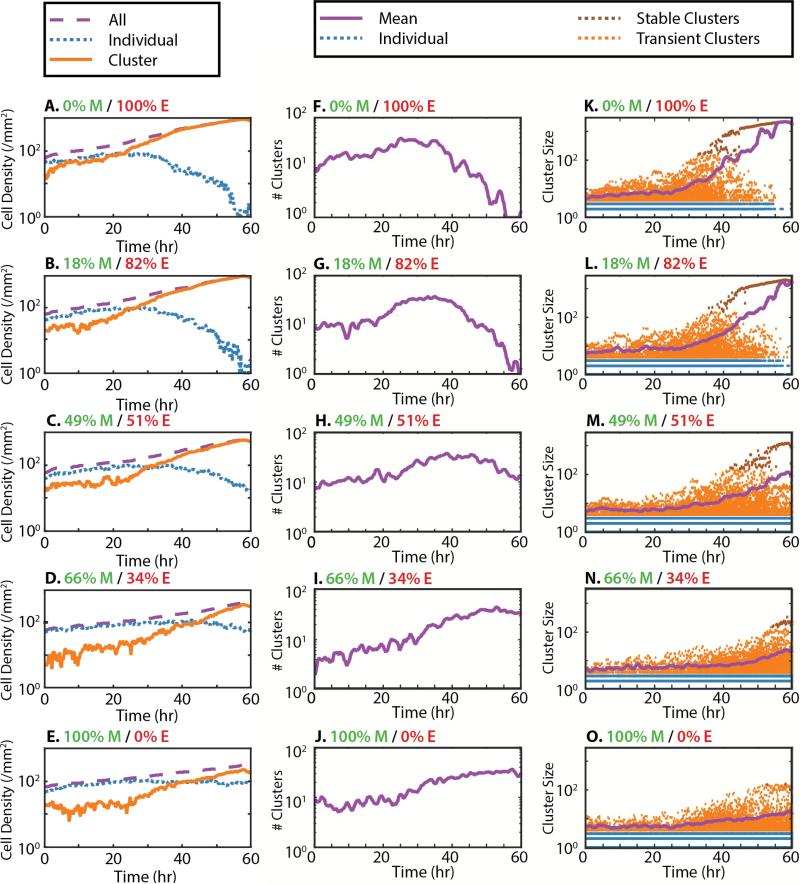
Figure 2.
Cell densities, number of clusters and cluster size distribution as a function of time and initial mesenchymal percentage (top to bottom). (A-E) Total cell density (purple dashes) and clustered cell density (orange) increased over time, while individual cell density (blue dots) decreased. (F-H) For low initial mesenchymal percentage, the number of clusters initially increased (purple line), then decreased down to a single cluster. (I, J) For higher mesenchymal percentage, the number of clusters steadily increased over time. (K-M). For low mesenchymal percentage, the cluster size distribution remained roughly constant until ~30 h, when the average cluster size increased rapidly (purple line). Individual cells are colored blue, clustered cells are colored orange and stable clusters are colored brown. (N, O) For higher mesenchymal percentage, the average cluster size only increased slightly.

