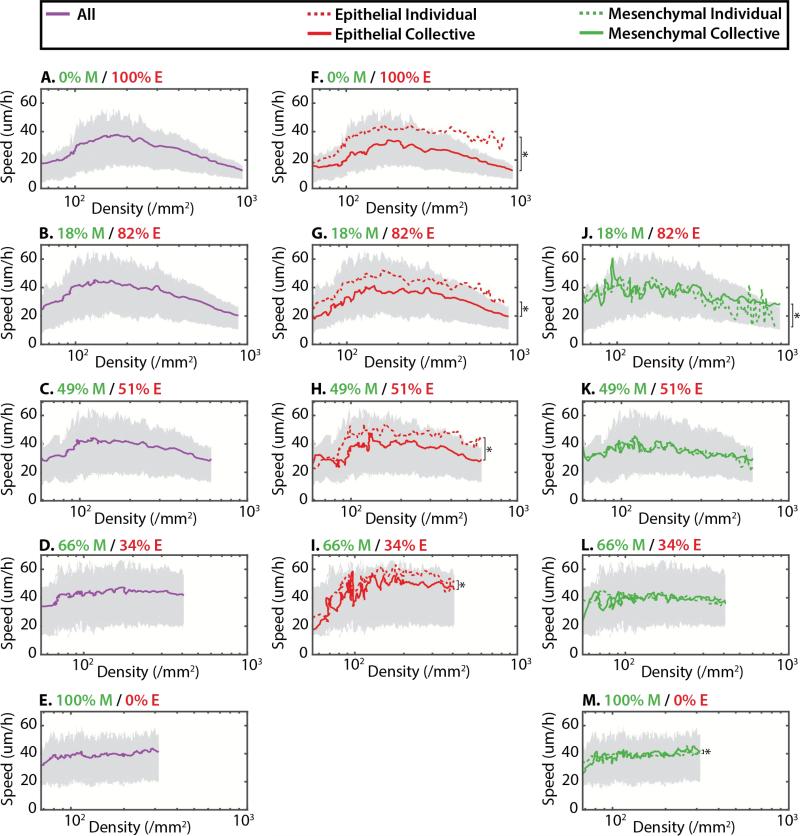
Figure 4.
Average root mean squared velocity is displayed as a function of cell density and initial mesenchymal percentage (top to bottom). Top and bottom quartiles (75%, 25%) are shown in gray for all plots. For low initial mesenchymal percentage, the overall velocity initially increased, then decreased with density (A-C). For high initial mesenchymal percentage, the overall velocity remained roughly constant with density (D-E). For all conditions, epithelial cells were significantly faster as individuals than in clusters (F-I). However, mesenchymal cells displayed similar average velocities as individuals and in clusters (J-M). * denotes statistically significant difference (p < 0.01)

