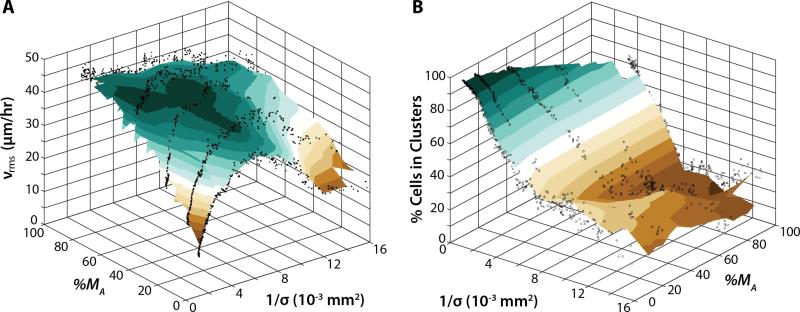
Figure 6.
(A) Phase diagram of average cell velocity as a function of reciprocal cell density and actual mesenchymal percentage. Migration was arrested near the origin for mostly epithelial populations and high cell densities. Increasing initial mesenchymal fraction also increased average cell velocity. (B) Phase diagram of the percentage of cells in clusters as a function of reciprocal cell density and initial mesenchymal percentage. Almost complete clustering occurred near the origin for mostly epithelial populations and high cell densities. Increasing initial mesenchymal fraction also decreased the percentage of cells in clusters.

