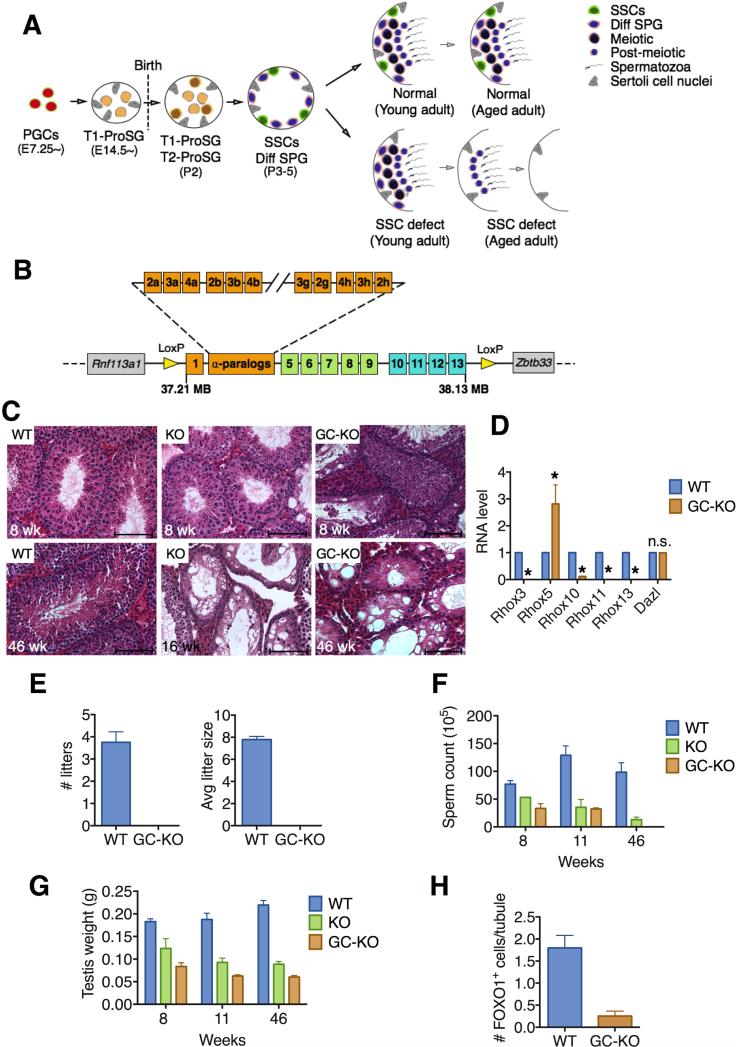
Figure 1. Loss of the Rhox Cluster Causes Progressive Spermatogenic Decline.
(A) Male germ cell development in normal and SSC-deficient mice. A SSC defect causes a progressive decline in spermatogenesis because the first wave of spermatogenesis is SSC independent. PGCs, primordial germ cells; ProSG, prospermatogonia; SSCs, spermatogonial stem cells; Diff SPG, differentiating spermatogonia.
(B) Strategy to conditionally delete the entire Rhox cluster: insertion of loxP sites (yellow arrows) at the beginning and end of the ~920-kb Rhox cluster (see Figure S1A for exact location of loxP sites).
(C) Hematoxylin and eosin staining of testes sections from Rhox-c-KO (labeled “KO”), Rhox-c fl/y;Vasa-Cre (labeled “GC-KO”), and control (WT) mice. Upper and lower rows are from 8- and 16-to-46-week-old mice, respectively. Scale bars = 100 μm.
(D) qRT-PCR analysis demonstrating selective defect in expression of germ cell-expressed Rhox genes in testes from 8 week-old Rhox-c fl/y;Vasa-Cre mice (GC-KO) relative to WT mice. Values were normalized to Rpl19 mRNA level and denote the mean fold change ± standard error of the mean (SEM). Asterisks indicate the difference is statistically significant (P<0.05).
(E) Testis weight of Rhox-c-KO (KO), Rhox-c fl/y; Vasa-Cre (GC-KO), and WT mice of the indicated ages.
(F) Epididymal sperm count of Rhox-c-KO (KO), Rhox-c fl/y; Vasa-Cre (GC-KO), and WT mice of the indicated ages.
(G) Fertility analysis of adult male Rhox-c fl/y;Vasa-Cre (GC-KO) and WT mice, each housed with two BL6 female mice (initially 8-weeks old) for 4 months. Values denote the mean ± standard error of the mean (SEM). Asterisks indicate that the difference is statistically significant (P<0.05).
(H) Quantification of FOXO1-positive spermatogonia in testes from 8 week-old Rhox-c fl/y;Vasa-Cre (GC-KO) and WT mice (n=3 per genotype). All values are mean ± SEM.
See also Figure S1

