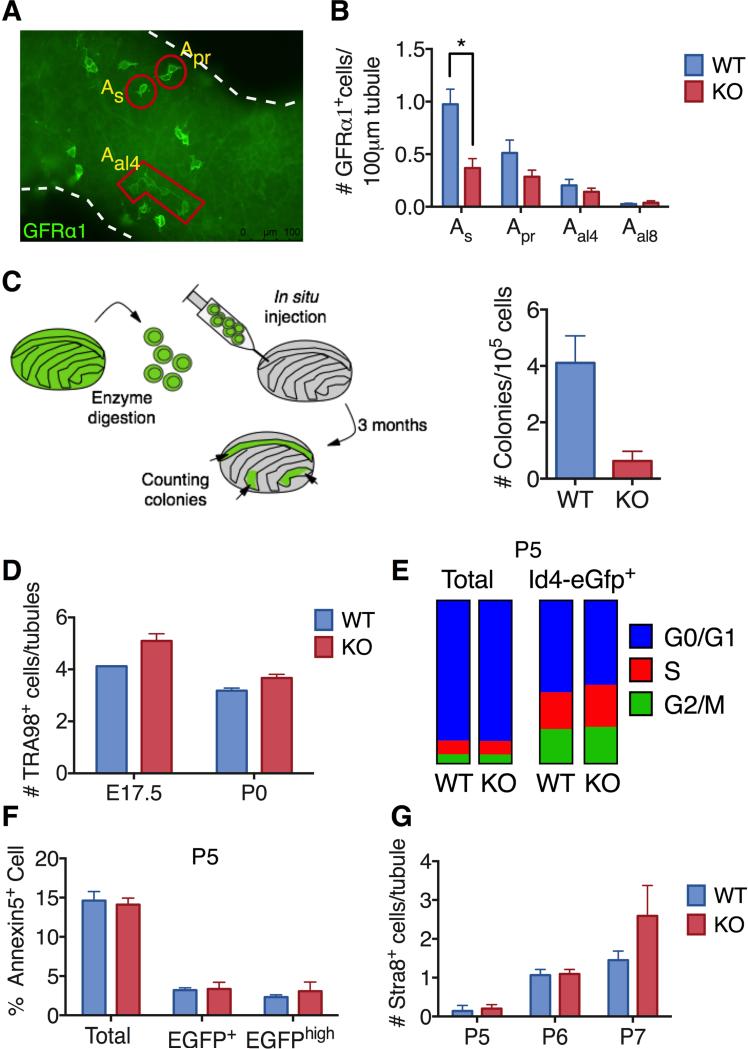
Figure 3. Loss of Rhox10 Causes SSC Defects.
(A) Representative image of whole mount staining of 6 month-old adult mice seminiferous tubules with GFRα1 antibody. As, Apr and Aal4 cells are positively stained with the GFRα1 antibody.
(B) Quantification of GFRα1+ spermatogonia in testes from 6- to 10-month-old Rhox10-KO and littermate control (WT) mice (n=4-5 per genotype). All values are mean ± SEM. Asterisks indicate differences that are statistically significant (P<0.05).
(C) Germ cell transplantation analysis. Donor-derived colonies in recipient testes were counted and normalized to 105 cells injected per testis 3 month after transplantation of testicular cells from P7-8 Rhox10-KO (Rhox10−/y;Ubc-Gfp) mice (n=4) and littermate control (WT) (Rhox10+/y;Ubc-Gfp) mice (n=5).
(D) Germ (TRA98+) cells per tubule in testes sections from Rhox10-KO and littermate control (WT) mice of the indicated ages (n=1-4, each time point).
(E) Cell cycle analysis of either total testicular cells or Id4-eGfp+ cells from P5 Rhox10-KO and littermate control (WT) mice (n=5).
(F) Flow cytometric analysis of Annexin V+ cells (among total, Id4-eGfp+ or Id4-eGfphigh testicular cells) from P5 Rhox10-KO mice (n=6) and littermate control (WT) mice (n=9).
(G) Quantification of STRA8+ cells in testes sections from Rhox10-KO and littermate control (WT) mice of the ages indicated (n=2-5, each time point). All values are mean ± SEM.
See also figure S3

