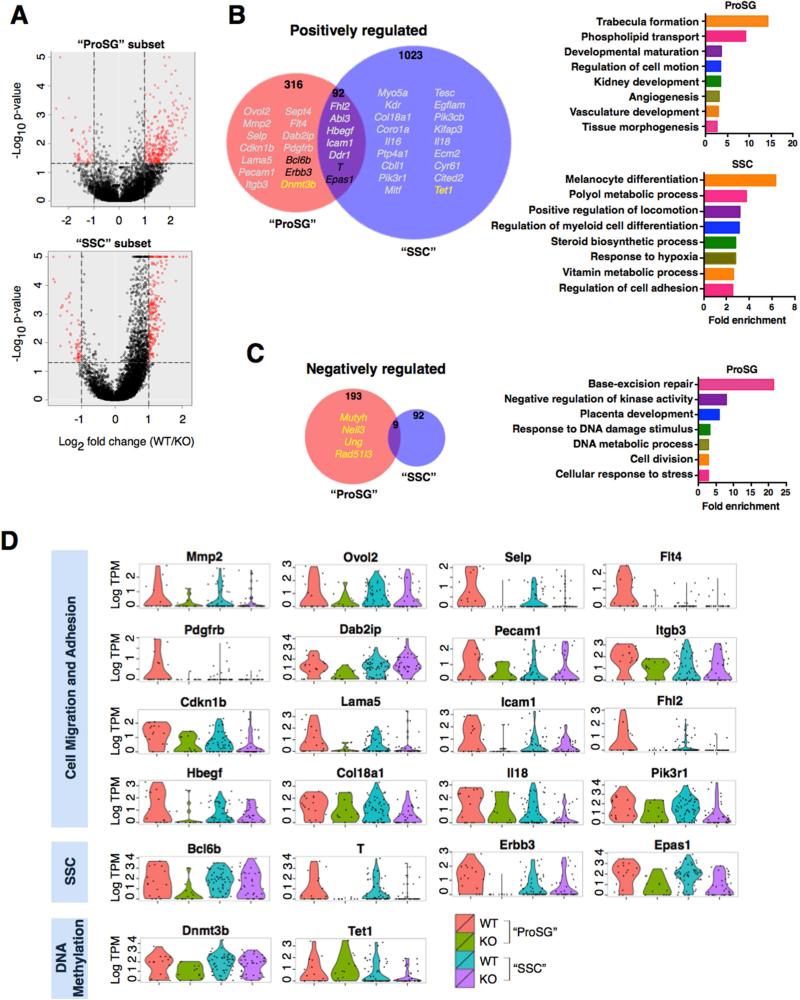
Figure 6. Rhox10-Regulated Genes in Germ Cell Subsets.
(A) SC-RNAseq coupled with SCDE analysis was used to identify genes differentially expressed in the “ProSG subset” (KOP3B vs. WTP3A; left) and “SSC subset” (KOP3C vs. WTP3B; right), as defined in Figure 5. Red points are genes >2-fold differentially expressed (P<0.05).
(B-C) (Left) Selected Rhox10-regulated genes (defined in panel A) are indicated with different colors: grey, Cell migration and adhesion; black, SSC genes; yellow, DNA methylation (>2 fold, P<0.05). Note that “Positively regulated” refers to genes upregulated by Rhox10 (i.e., downregulated in Rhox10-KO cells) and “Negatively regulated” refers to the converse. (Right) Selected highly enriched GO categories are shown (>2.5 fold enrichment, P<0.02). Note that there is no significantly enriched GO category for Rhox10-negatively regulated genes in the SSC subset.
(D) The level of RHOX10-positively regulated genes in single cells in the “ProSG” and “SSC” subsets.

