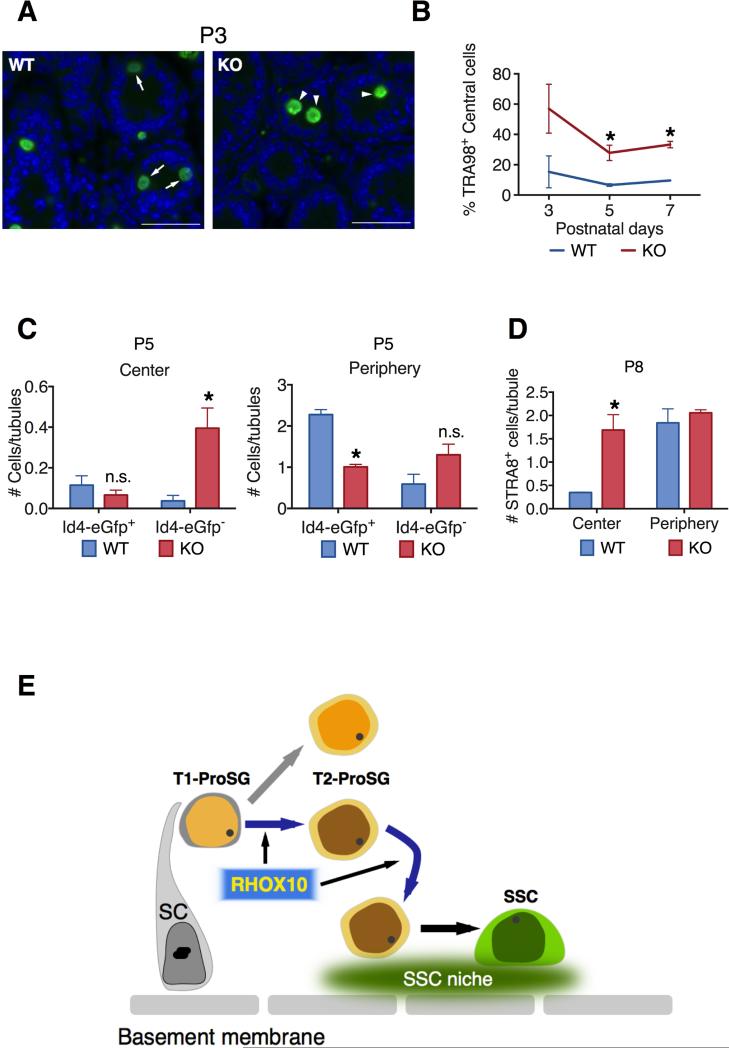
Figure 7. Evidence that Rhox10 Promotes ProSG Migration into the SSC Niche.
(A) Representative images of germ cells (stained with TRA98) in testes cross-sections from P3 Rhox10-KO mice and littermate control (WT) mice. Arrows, cells located in the periphery; Arrow heads, cells located in the center. Scale bars = 20 μm.
(B) Percentage of TRA98+ germ cells located in the center of seminiferous tubules as compared to total TRA98+ germ cells in Rhox10-KO mice and littermate control (WT) mice of the indicated age (n= 2-5 each time point). All values are mean ± SEM. Asterisks indicate statistically significant differences (P<0.05).
(C) Quantification of FOXO1+ cells co-stained for Id4-eGfp located in the center (Left) or periphery (Right) of seminiferous tubules in P5 Rhox10-KO mice (n=3) and littermate control (WT) mice (n=2). All values are mean ± SEM. Asterisks indicate statistically significant differences (P<0.05).
(D) Quantification of STRA8+ cells (differentiating A-spermatogonia) located in the center or periphery of seminiferous tubules in P8 Rhox10-KO mice and littermate control (WT) mice (n=2). All values are mean ± SEM. Asterisks indicate statistically significant differences (P<0.05).
(E) Model: Rhox10 promotes ProSG progression into SSCs. The model posits that Rhox10 drives both the T1-ProSG-to-T2-ProSG differentiation step and the ProSG migration step, which temporal studies suggest may occur simultaneously. Depicted are two kinds of T2-ProSG, each with a different fate, a possibility that is consistent with published studies (Kluin and de Rooij, 1981; Murphey et al., 2013), but has not been directly demonstrated. SC, Sertoli cell.
See also Figure S7.

