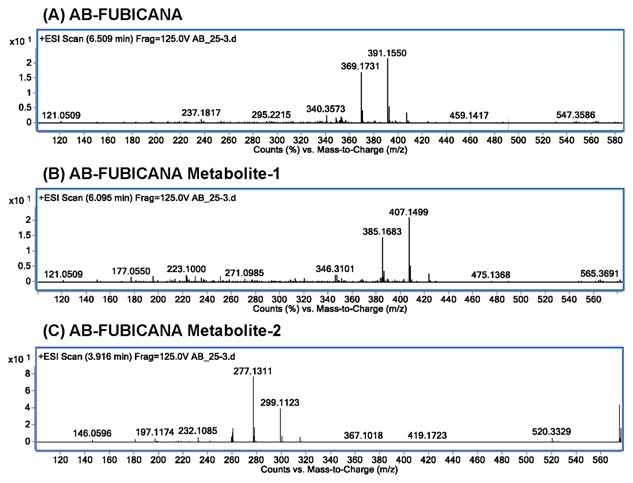
Figure 2.

The TOF mass spectrum for AB‐FUBINACA and its metabolites. (A) The TOF mass spectrum for AB‐FUBINACA at retention time of 6.509 min yielded exact mass of m/z 369.1731, paired with salt adduct m/z 391.1550. (B) The TOF mass spectrum for AB‐FUBINACA metabolite‐1 at retention time of 6.095 min shows exact mass of m/z 385.1683, paired with salt adduct m/z 407.1499. (C) The TOF mass spectrum for AB‐FUBINACA metabolite‐2 at retention time of 3.916 min shows exact mass of m/z 277.1311, paired with salt adduct m/z 299.1123.
