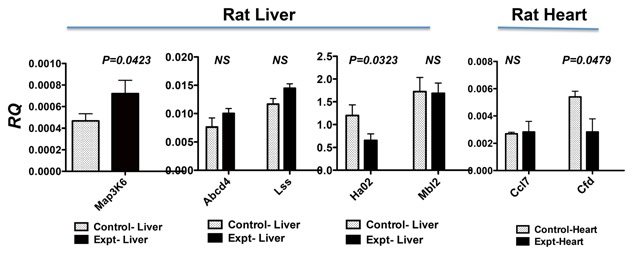
Figure 7.

Real‐time quantitative RT‐PCR analysis of genes identified by PCR arrays. Total RNA was treated with DNase I, followed by reverse transcription to generate cDNA. We used SYBR Green I dye to quantify gene expression levels in cDNAs using gene‐specific primers. Each gene was normalized with house keeping gene Hprt1. The results are expressed as relative quantification values (RQ). Animals treated with AB‐FUBINACA (black bar) were compared with PBS‐treated control animals (open bar). The results were analyzed by unpaired t‐test with one‐tail using the software by Prism, version 5.0. The P values less than 0.05 are considered significant; the P values are listed in the figure. The P values higher than 0.05 are not significant as shown in NS. Both results of rat liver and heart are presented in this figure.
