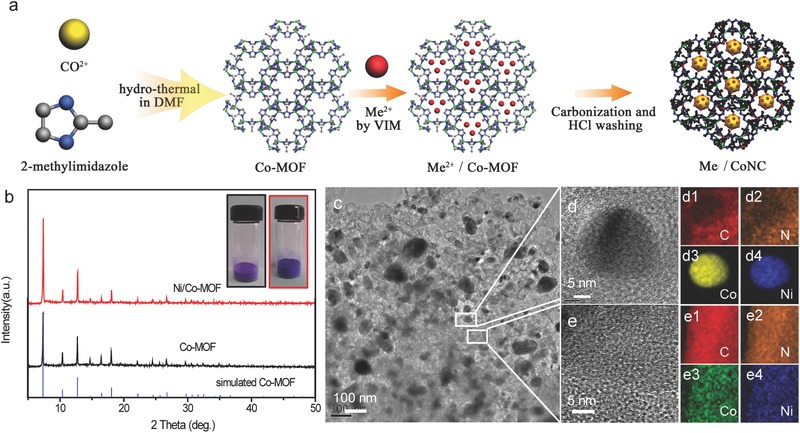
Figure 1.

a) Schematic diagram of the preparation process for the metal/CoNC catalysts. b) XRD spectra of the simulated Co‐MOF, as‐prepared Co‐MOF, and Ni/Co‐MOF samples. c–e) TEM images of the as‐synthesized Ni/CoNC catalyst. EELS elemental maps of d1, e1) C, d2, e2) N, d3, e3) Co, and d4, e4) Ni.
