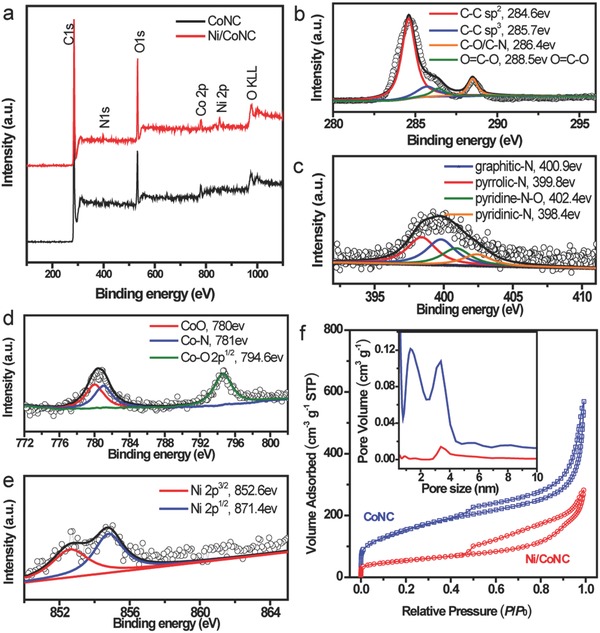
Figure 2.

a) XPS survey spectra of the CoNC and Ni/CoNC catalysts. Core level: b) C1s, c) N1s, d) Co 2p, and e) Ni 2p XPS spectra of the Ni/CoNC catalyst. f) Nitrogen isothermal adsorption/desorption curves of the CoNC and Ni/CoNC catalysts. The inset is their corresponding pore size distribution.
