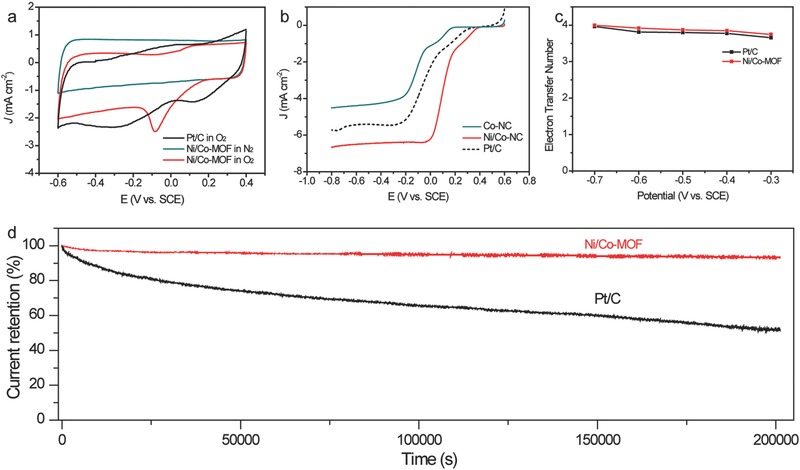
Figure 4.

a) CV curves of the Ni/CoNC and Pt/C catalysts in O2‐ and Ar‐saturated 0.01 m PBS solution. b) LSV curves of the Ni/CoNC and Pt/C catalysts collected in O2‐saturated 0.01 m PBS at 1600 rpm. c) The calculated ORR electron‐transfer number for the Ni/CoNC catalyst at different potentials. d) Current retention curves of the Ni/CoNC and Pt/C catalysts recorded at −0.3 V in O2‐saturated 0.01 m PBS electrolyte.
