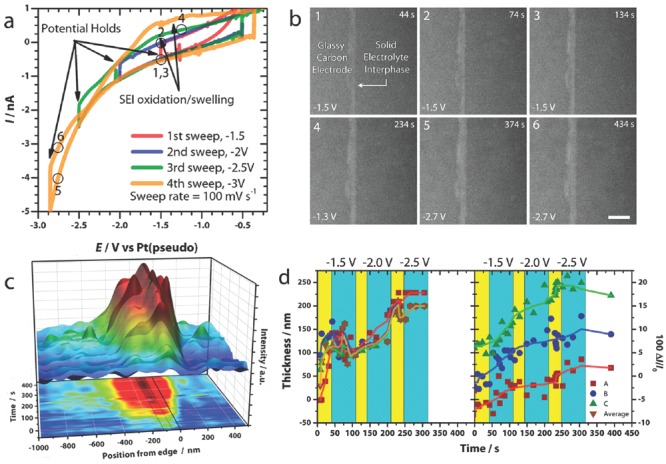
Figure 5.

In situ ec‐S/TEM characterization of SEI.49 a) Sweep‐hold voltammograms of glassy carbon in 1.2 M LiPF6 in EC/DEC electrolyte. b) A family of STEM images exhibiting SEI evolution during the sweep‐hold experiment. The correlated Points 1–6 are described in the profile exhibited in (a). Scale bar in (b) is 1 μm. c,d) The relationship between the SEI thickness/relative image intensity and time. The colored regions in c&d relate to potential sweeps (yellow) and potential holds (cyan). Reproduced with permission.49 Copyright 2015, American Chemical Society.
