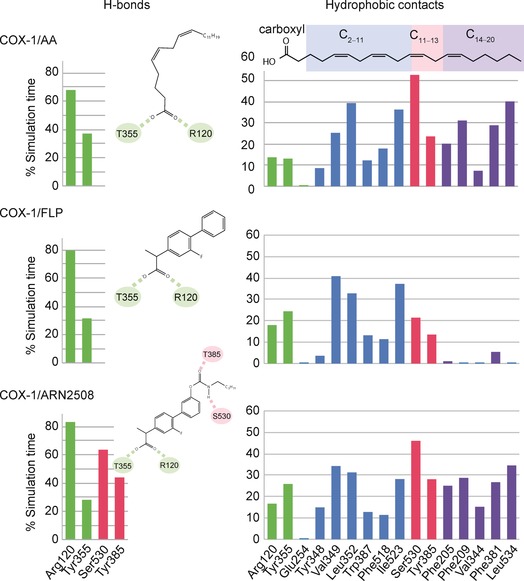
Figure 4.

Statistical distribution (% of the total simulation time) over the whole production run of the H‐bonds (left) and the hydrophobic contacts (right) established by AA (top), FLP (middle), and ARN2508 (bottom) with the carboxyl (green bars), C2–C11 (blue bars), C12–C13 (red bars), and C14–C20 (violet bars) interaction regions of the COX‐1 active site. Interaction regions are defined based on the interaction network of the moieties of AA in the X‐ray structure (PDB code: 1DIY).4 Importantly, statistics were collected as a sum of the data arising from both COX‐1 subunits of each equilibrated system. Full details on statistical analysis are reported in the Supporting Information.
