

Abstract
Objectives
To evaluate the biological effect of a paclitaxel‐coated balloon (PCB) technology on vascular drug distribution and healing in drug eluting stent restenosis (DES‐ISR) swine model.
Background
The mechanism of action and healing response via PCB technology in DES‐ISR is not completely understood.
Methods
A total of 27 bare metal stents were implanted in coronary arteries and 30 days later the in‐stent restenosis was treated with PCB. Treated segments were harvested at 1 hr, 14 days and 30 days post treatment for the pharmacokinetic analysis. In addition, 24 DES were implanted in coronary arteries for 30 days, then all DES‐ISRs were treated with either PCB (n = 12) or uncoated balloon (n = 12). At day 60, vessels were harvested for histology following angiography and optical coherence tomography (OCT).
Results
The paclitaxel level in neointimal tissue was about 18 times higher (P = 0.0004) at 1 hr C max, and retained about five times higher (P = 0.008) at day 60 than that in vessel wall. A homogenous distribution of paclitaxel in ISR was demonstrated by using fluorescently labeled paclitaxel. Notably, in DES‐ISR, both termination OCT and quantitative coronary angioplasty showed a significant neointimal reduction and less late lumen loss (P = 0.05 and P = 0.03, respectively) post PCB versus post uncoated balloon. The PES‐ISR + PCB group displayed higher levels of peri‐strut inflammation and fibrin scores compared to the ‐limus DES‐ISR + PCB group.
Conclusions
In ISR, paclitaxel is primarily deposited in neointimal tissue and effectively retained over time following PCB use. Despite the presence of metallic struts, a uniform distribution was characterized. PCB demonstrated an equivalent biological effect in DES‐ISR without significantly increasing inflammation. © 2015 Wiley Periodicals, Inc.
Keywords: drug eluting balloon, in‐stent restenosis, pharmacokinetics, preclinical coronary model
INTRODUCTION
Drug eluting stent in‐stent restenosis (DES‐ISR) is a known limitation in clinical practice following percutaneous coronary intervention 1. Despite its inherent biological and technical limitations, the use of a second DES (“stent sandwich”) is a common therapeutic approach among practicing physicians 2. The use of paclitaxel‐coated balloon (PCB) technologies for this particular application has shown to be a promising therapeutic alternative to treat ISR 3, 4, 5, 6, 7, 8. Theoretically speaking, the use of PCB has the advantage of not adding additional layers of metal and polymer to the artery which would potentially decrease the need for long term dual anti‐platelet therapy. DES‐ISR follows a more complex biological process compared to bare metal stent in‐stent restenosis (BMS‐ISR) due to the variable presence of the drug and polymer on the stented segment. Although PCB are commonly used in the clinical setting to treat this condition 9, there are limited experimental data in regards to the biological effects of PCB use in DES‐ISR applications. In these studies, we aimed to evaluate the biological effect of a PCB technology on vascular drug distribution in ISR and healing in DES‐ISR swine model (Fig. 1).
Figure 1.
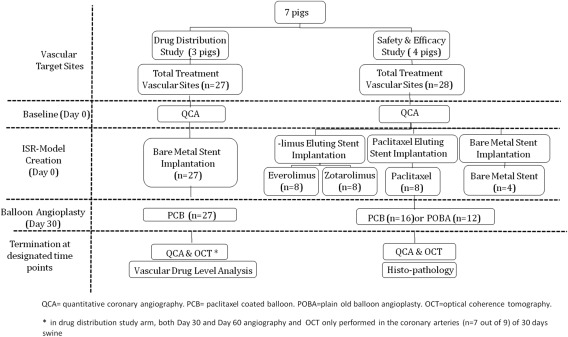
Flowchart of the study design.
MATERIALS AND METHODS
Device Description
The PCBs used in these series of studies were Lutonix drug coated balloon catheter (Bard Lutonix, New Hope, MN). This technology comprises a standard peripheral angioplasty balloon catheter coated with a proprietary paclitaxel (2 µg/mm2) and excipients (polysorbate and sorbitol) on the surface of the balloon. The control balloons used in this study (2.5, 3.0, or 3.5 × 12 mm) were of identical material and manufactured by the same vendor (Clearstream, Bard Peripheral Vascular, Tempe, AZ).
Paclitaxel‐eluting stent (PES), Taxus™ Liberte™, Boston Scientific, Marlborough, Massachusetts; Everolimus Eluting Stent, Xience‐Pro, and Vision Multi‐Link 8, Abbott Vascular, Chicago, Illinois; and Zotarolimus Eluting Stent, Resolute Integrity, Medtronic Vascular, Minneapolis, Minnesota. All stents were 2.5–3.5 mm × 8 mm.
Animal Study General Methodology
All studies were approved by the Institutional Animal Care and Use Committee at APS (American Preclinical Service). All animals received standard care in accordance with the act of animal welfare and the “Principles of Care of Laboratory Animals” formulated by the Institute of Laboratory Animal Resources (National Research Council, NIH Publication No. 85‐23, revised 1996). All animals were castrated Yorkshire swine (weight 35–45 kg) and maintained on a regular chow diet. Dual anti‐platelet therapy (Clopidogre l75 mg and aspirin 81 mg, once a day) were given to all pigs 3 days prior to stenting and maintained until terminations. Once general anesthesia and endotracheal intubation was achieved, arterial carotid access was obtained. Anticoagulation with heparin was achieved to maintain an Activated Clotting Time ≥250 seconds. At day 0, all target vessels were angiographically sized and each target treatment site was selected for stent implantation. At day 30, all balloons, PCB and plain old balloon angioplasty (POBA) were inflated in ISR segments for 30 seconds. At designated terminations, animals were euthanized by a commercial barbiturate euthanasia solution.
Paclitaxel Vascular Distribution Assessments in ISR Model
To avoid concomitant drug interference from the DES during bioanalytical testing of paclitaxel level in vascular tissues, BMS‐ISR model was chosen for PCB drug distribution assessments. At day 0, a total of 27 Vision stents were implanted in healthy coronary arteries (three domestic swine, two or three stents in each RCA, LCX, and LAD, respectively) and internal mammary arteries (one stent in each right internal mammary and left internal mammary artery respectively) to create BMS‐ISR model. The target stent: artery overstretch ratio (SAR) was: 1.20:1.25. At day 30, following angiography of the stented segment, total 27 PCBs (2.5–3.5 × 12 mm) was inflated in ISR segment for 30 seconds. The treated arteries were harvested post PCB treatment at 1 hr, 14 days and 30 days, and the neointimal layer and vessel wall tissue were dissected to determine paclitaxel tissue levels (Fig. 1). Samples were snap frozen and placed in labeled containers with animal number, vessel ID, and test device ID and stored at −7°C, then sent for analysis. The paclitaxel content analyses were performed at PPD Development, L.P. (Middleton, WI) using quantitative liquid chromatography‐tandem mass spectrometry (LC‐MS/MS) assay. In addition, for 30 days‐group, optical coherence tomography (OCT) and follow‐up quantitative coronary angiography (QCA) were performed pre‐and post‐PCB angioplasty and at termination to make control sample numbers comparable to tests in vascular healing assessment.
In a separate analysis, three coronary arteries were used for paclitaxel in situ bio‐distribution study. Three PCBs were coated using fluorescent labeled‐paclitaxel (Oregon Green 448; Molecular Probes, Invitrogen, Paisley, UK). The fluorescent paclitaxel was conjugate‐coated onto the 3.0 × 12 mm PCB balloon and inflated in the entire 8 mm ISR segment with approximately 2 mm beyond the distal and proximal edge of the stent. Total inflation time was 30 seconds. The treated stented segments were collected 1 hr after PCB inflation and cut longitudinally and unfolded. In situ visualization of three‐dimensional distribution of paclitaxel after PCB inflation was assessed through en face imaging on the whole mount artery with neointimal layer facing the fluorescent microscope (Nikon E600 Melville, NY) . Additional frozen cross sections were prepared from the distal and proximal non‐stented segments for drug distribution assessment as well. The transmural distribution of paclitaxel was imaged on cryo‐cross sections.
Vascular Healing Assessments in DES‐ISR Model
At day 0, a total of 24 DES of different types and four BMS were randomly implanted in healthy coronary arteries of four swine (two or three stents in each of RCA, LCX and LAD respectively). At day 30, following DES implantation, angiography and OCT analysis was performed for baselines and followed by either PCB (n = 12) or POBA (n = 12) (all PCB and POBA were 2.5–3.5 mm × 12 mm) treatment in a random fashion. A total of four BMS control segments were treated by PCB (n = 4) only. At day 60, all vessels underwent follow‐up QCA and OCT, and then were subsequently harvested for scanning electron microscopy (SEM) and histopathology assessment (Fig. 1).
QCA Evaluation
Quantitative Vascular Analysis software (Pie Medical Quote Imaging BV, Maastricht, The Netherlands) was used for QCA. Mean and/or minimal lumen diameter (MLD) were measured by an observer blinded to the device identity (ID), at day 0 pre‐ and post‐stenting, at day 30 (baselines), immediately post‐ balloon treatments and at day 60 terminal procedures within stented segment. The stent to artery ratio (SAR) and balloon to artery ratio (BAR) were calculated per mean lumen diameter. Artery percent diameter stenosis (%DS) at day 60 termination was calculated as:
Late lumen loss (LLL) at day 60 termination was calculated as: LLL = MLD post balloon treatment‐MLD at termination.
OCT Evaluation
OCT (llumien, St. Jude Medical, St. Paul, Minnesota) was performed at day 30 baselines, immediately post‐balloon angioplasty and at day 60 termination. OCT pullback images were captured at each stented segment. The minimal lumen area (LA) and stent area (SA) were used for percent area stenosis (%AS) calculation by an experienced observer blinded to device ID. % AS was calculated as: 100 × (1 − minimal LA/SA). The difference of % AS (Δ% AS) was evaluated as: %AS at termination versus %AS at baselines. The neointimal area (NA) was calculated as: SA‐minimal LA. The difference of neointimal area (ΔNA) was evaluated as: NA at termination versus NA at baselines.
Histopathology and SEM Analysis
Following fixation, stented coronaries were harvested, processed, and embedded in resin and sectioned in three sub‐segments (proximal, middle and distal). A thin section (∼5 µm) was stained with hematoxylin and eosin. Degree of vascular injury, inflammation, fibrin deposition, luminal thrombosis, medial hypocellularity and endothelialization was evaluated via light microscopy following a standardized and previously published score system 10. Morphometric analysis was performed by Image‐Pro® Plus software (Media Cybernetics, Rockville, MD). Vascular areas [mm2, internal elastic lamina (IEL), external elastic lamina (EEL), and LA, and SA] were acquired and utilized to calculate neointimal thickness (NT, mm, [internal elastic diameter‐lumen diameter]/2) and %AS (1 − LA/IEL area) × 100. Three (3) non‐fixed treated arteries from each group (DES + PCB, DES + POBA, and BMS + PCB), at each time point, were scanned by SEM (Hitachi, TM 3000), to assess healing as determined by strut coverage and thrombosis. The study histopathologist was blinded for device ID during scoring.
Statistical Analysis
Values are expressed as means ± standard deviation. Normality tests were performed prior to conducting comparison tests. For non‐parametric PK and QCA data, Mann‐Whitney test was used for the differences in continuous variables between each two groups. For non‐parametric histology ordinal data, Kruskal‐Wallis test was used for the differences in variables between two groups. For normally distributed OCT data, a two‐slided Student t‐test was performed to determine statistical significant difference between each two groups. All P values were calculated by using Minitab 15 (Minitab, State College, PA). A value of P ≤ 0.05 was considered statistically significant. No statistical analysis was performed in DES subgroups comparison due to limited sample number (n < 5) in two subgroups.
RESULTS
Paclitaxel Vascular Pharmacokinetics and in Situ Distribution in ISR
The 1 hr C max (maximum concentration) of paclitaxel following PCB delivery in neointimal tissues was about 18 times higher than the 1 hr C max concentration found in vessel wall (P = 0.0004, Fig. 2). At day 60, although a progressive decline in paclitaxel tissue levels were observed, there was still about five times higher drug concentration in neointimal tissue than that in vessel wall tissue (P = 0.04, Fig. 2). Fluorescently labeled paclitaxel derivative‐coating of PCB balloon study suggested a homogenous distribution of the labeled drug on en face examination of the luminal surface of the stented segment (Fig. 3a) and on the cross section of the non‐stented reference segment 1 hr after PCB inflation (Fig. 3b).
Figure 2.
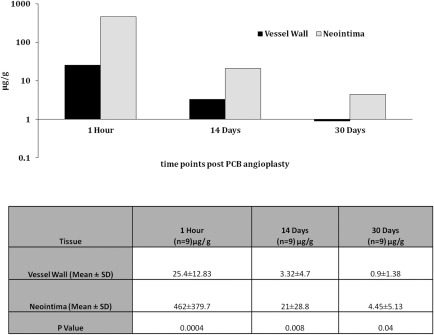
Paclitaxel level in neointimal and vessel wall tissues in bare metal stent in‐stent restenosis (BMS‐ISR) model.
Figure 3.
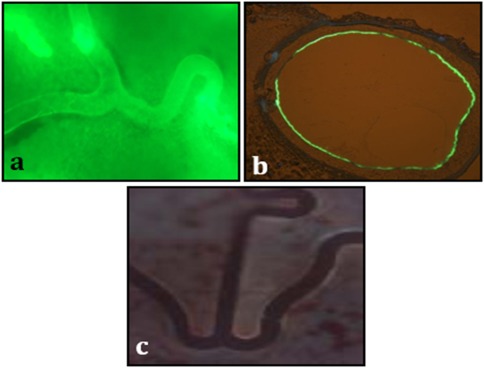
Representative images of fluorescently labeled paclitaxel distribution. Post PCB (Paclitaxel‐Coated Balloon) inflation at stented segment (en face 10×, Fig. 3a), a cross section of non‐stented reference segment (Fig. 3b) and a control (en face 10×, Fig. 3c). [Color figure can be viewed in the online issue, which is available at wileyonlinelibrary.com.]
QCA Analysis
QCA baseline parameters were comparable among three groups from day 0 to day 30 (Table 1). At day 60, the DES‐ISR group treated with PCB resulted in the lower degree of %DS and angiographic LLL compared to DES‐ISR treated with POBA (P = 0.03 and P = 0.02 respectively, Table 1). In the DES subgroup analysis, the use of a PCB in the paclitaxel‐DES‐ISR resulted in lower levels of angiographic % DS and less LLL compared to ‐limus‐DES‐ISR group.
Table 1.
Summary of Angiographic Data at Day 0, Day 30 and Day 60 Termination (30 Days Post Balloon Angioplasty)
| ISR model creation (day 0) | Balloon treatment (day 30) | Termination (day 60) | |||||
|---|---|---|---|---|---|---|---|
| Study Group | AVD (mm) | Stent sizes diameter (n) | Overstretch ratio | Post‐treatment MLD (mm) | MLD (mm) | Late lumen loss (mm) | %DS |
| DES + POBA (n = 11a) | 2.69 ± 0.34 | 2.5(1), 3.0(4), 3.5(7) | 1.3 ± 0.09 | 2.19 ± 0.23 | 1.89 ± 0.4 | 0.24 ± 0.43 | 8.27 ± 18.98 |
| DES + PCB (n = 12) | 2.68 ± 0.28 | 2.5(1), 3.0(6), 3.5(5) | 1.31 ± 0.08 | 2.02 ± 0.49 | 2.07 ± 0.33 | −0.05 ± 0.26 | −9.58 ± 21.68 |
| BMS + PCB (n = 11) | 2.61 ± 0.4 | 2.5(1), 3.0(6), 3.5(5) | 1.29 ± 0.05 | 2.09 ± 0.46 | 1.86 ± 0.44 | 0.18 ± 0.14 | 8.20 ± 7.16 |
| P value | NSb; NSc; NSd | NSb; NSc; NSd | NSb; NSc; NSd | NSb; NSc; NSd | 0.03b; NSc; 0.01d | 0.02b; NSc; 0.001d | |
| PES+PCB (n = 4) | 2.67 ± 0.12 | 3.0(3), 3.5(1) | 1.28 ± 0.05 | 2.20 ± 0.50 | 2.29 ± 0.25 | −0.28 ± 0.44 | −20 ± 30.5 |
| PES+POBA (n = 4) | 2.69 ± 0.48 | 2.5(1), 3.0(1), 3.5(2) | 1.28 ± 0.09 | 2.30 ± 0.18 | 2.08 ± 0.36 | 0.22 ± 0.46 | 8.8 ± 18.8 |
| ‐limus DES +PCB (n = 8) | 2.69 ± 0.32 | 2.5(1), 3.0(3), 3.5(4) | 1.32 ± 0.09 | 1.96 ± 0.50 | 1.99 ± 0.33 | −0.03 ± 0.28 | −4.37 ± 15.7 |
| ‐limus DES+POBA (n = 7a) | 2.69 ± 0.27 | 3.0(3), 3.5(5) | 1.31 ± 0.09 | 2.11 ± 0.24 | 1.78 ± 0.41 | 0.25 ± 0.45 | 8 ± 20.6 |
POBA, Plain Old Balloon Angioplasty; PCB, Paclitaxel‐Coated Balloon; AVD, Average Vessel Diameter; MLD, minimal lumen diameter; ISR, In‐Stent Restenosis; aOne angiographic data was missed bDES + POBA vs. DES + PCB; cDES + POBA vs. BMS + PCB; dDES + PCB vs. BMS + PCB; NS, not statistically significant.
OCT Analysis
At day 30, OCT baseline parameters were comparable between DES‐ISR groups (DES+PCB and DES+POBA, Table 2). At day 60 termination, the NA in DES‐PCB group was significantly lower than that in other two groups (versus DES+POBA, P = 0.05; and versus BMS+PCB, P = 0.01). Importantly, both NA and %AS at termination were significantly reduced with a use of PCB in both DES‐ISR and BMS‐ISR compared to their baselines (P = 0.02∼0.001, Table 2). In contrast, both %AS and neointimal proliferation were no significant difference at the termination compared to their baselines when DES‐ISR was treated with POBA (Table 2 and Fig. 4).
Table 2.
OCT Data at Day 30 and Day 60 (30 Days Post Balloon Angioplasty)
| Group | Baselines (at day 30) | Termination (at day 60) | Δ%AS P values** | ΔNA (mm2) P values** | ||||||
|---|---|---|---|---|---|---|---|---|---|---|
| Minimal LA (mm2) | Stent area (mm2) | AS (%) | NA (mm2) | Minimal LA (mm2) | Stent area (mm2) | AS (%) | NA (mm2) | |||
| DES + POBA (n = 11a) | 3.99 ± 2.09 | 8.46 ± 2.11 | 52.51 ± 23.67 | 4.47 ± 2.39 | 3.79 ± 1.48 | 8.32 ± 1.65 | 52.45 ± 21.76 | 4.53 ± 2.46 | ns | ns |
| DES + PCB (n = 12) | 4.19 ± 2.02 | 8.39 ± 1.71 | 51.38 ± 19.48 | 4.19 ± 1.43 | 5.33 ± 1.9 | 8.37 ± 1.74 | 37.44 ± 15.7 | 2.79 ± 1.45 | 0.02 | 0.008 |
| BMS + PCB (n = 11) | 2.56 ± 1.14 | 7.69 ± 1.87 | 68.06 ± 9.54 | 5.13 ± 1.02 | 3.75 ± 1.59 | 7.92 ± 2.19 | 54.16 ± 8.72 | 4.17 ± 0.91 | 0.001 | 0.002 |
| P value | NSb; NSc; 0.03d | NSb; NSc; NSd | NSb; NSc; NSd | NSb; NSc; NSc | 0.046*; NSc; 0.048d | NSb; NSc; NSd | NSb; NSc; 0.008d | 0.05*; NSc; 0.01d | ||
| PES + PCB (n = 4) | 5.04 ± 1.98 | 8.33 ± 1.57 | 38.99 ± 23.74 | 3.29 ± 1.96 | 6.43 ± 0.95 | 8.74 ± 1.45 | 26.28 ± 1.43 | 2.31 ± 0.50 | ||
| PES + POBA (n = 4) | 5.56 ± 2.15 | 8.35 ± 2.61 | 34.19 ± 16.6 | 2.79 ± 1.39 | 4.57 ± 1.95 | 7.95 ± 1.97 | 39.07 ± 29.17 | 3.38 ± 3.25 | ||
| ‐limus DES + PCB (n = 8) | 3.77 ± 2.03 | 8.41 ± 1.88 | 57.58 ± 14.94 | 4.64 ± 0.92 | 4.7 ± 2.07 | 8.16 ± 1.97 | 43.82 ± 16.71 | 3.46 ± 1.33 | ||
| ‐limus DES + POBA (n = 7a) | 3.2 ± 1.67 | 8.52 ± 2.02 | 61.67 ± 21.79 | 5.32 ± 2.39 | 3.4 ± 1.14 | 8.51 ± 1.59 | 59.15 ± 15.02 | 5.10 ± 1.96 | ||
aOne OCT data was missed bDES + POBA vs. DES + PCB; cDES + POBA vs. BMS + PCB; dDES + PCB vs. BMS + PCB; NS, not statistically significant.
Figure 4.
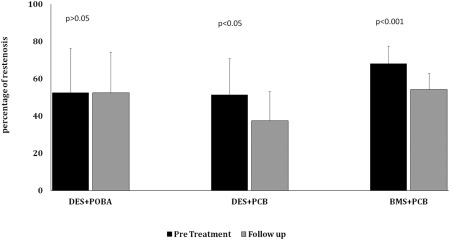
OCT analysis of difference of percent area stenosis (mean and standard deviation) between baselines (pre balloon treatment) versus 30 days follow‐up in DES‐ISR (Drug Eluting Stent In‐Stent Restenosis) treated with either POBA(Plain old balloon angioplasty) or PCB (Paclitaxel‐Coated Balloon), and in BMS‐ISR ((Bare Metal Stent In‐Stent Restenosis) treated with PCB.
In the DES subgroup analysis, both NA and %AS at termination were numerically smaller with a use of PCB in the paclitaxel‐DES‐ISR than that in the limus‐DES‐ISR, which was consistent with QCA termination data.
Histological Evaluation
The injury score was comparable among all tested groups (Table 3). Overall, vessel wall inflammation was lower in the BMS‐ISR+PCB group compared to both DES‐ISR+PCB and DES‐ISR+POBA groups. The presence of this inflammatory response was evenly distributed between media, neointima and adventitial layers. The degree of endothelialization, fibrin deposition, thrombosis and neointimal maturity was similar among all PCB and POBA treated groups. In terms of surface healing, SEM evaluation showed no evidence of thrombosis in any groups analyzed and all stent struts were completely covered by endothelial cells, except three vessels (PES + PCB, PES + POBA, and limus DES + PCB) from the same pig with ∼80% endothelialization). In the DES subgroup analysis, the %AS was numerically smaller with a use of PCB in the paclitaxel‐DES‐ISR than that in the limus‐DES‐ISR (Fig. 5). However, the NA was bigger in paclitaxel‐DES‐ISR than that in the limus‐DES‐ISR (Fig. 6).
Table 3.
Histology Data at Day 60 Termination (30 Days Post Balloon Angioplasty)
| Injury Score | Inflammation | Media inflammation | Neointima inflammation | Adventitial inflammation | Endothelialization | Fibrin | Neointimal maturity | Neointima hypoellularity | Media hypocellularity | Thrombosis | |
|---|---|---|---|---|---|---|---|---|---|---|---|
| DES + POBA (n = 12) | 1 ± 0.9 | 2 ± 1 | 1.3 ± 0.9 | 1.2 ± 0.8 | 1.6 ± 0.73 | 3.9 ± 0.2 | 0.7 ± 0.6 | 3.9 ± 0.4 | 0.5 ± 0.8 | 0.9 ± 1.2 | 0.0 ± 0.1 |
| DES + PCB (n = 12) | 0.8 ± 0.9 | 1.7 ± 1.3 | 1.5 ± 1.3 | 1.3 ± 1.1 | 1.2 ± 1.01 | 3.5 ± 0.6 | 1 ± 0.6 | 3.6 ± 0.6 | 1.1 ± 0.9 | 0.9 ± 0.9 | 0.1 ± 0.2 |
| P value | ns | ns | ns | ns | ns | ns | ns | ns | ns | ns | ns |
| BMS + PCB (n = 4) | 1.1 ± 0.6 | 1.1 ± 0.8 | 0.5 ± 0.6 | 0.9 ± 0.9 | 0.6 ± 0.5 | 3.5 ± 0.6 | 0.7 ± 0.7 | 3.8 ± 0.3 | 2.1 ± 0.3 | 1.1 ± 0.6 | 0.2 ± 0.6 |
| PES + PCB (n = 4) | 1 ± 1.4 | 1.9 ± 1.7 | 1.8 ± 1.8 | 1.8 ± 1.5 | 1.3 ± 1.1 | 3.3 ± 0.8 | 1.3 ± 0.9 | 3.2 ± 0.9 | 1.5 ± 1.0 | 1.5 ± 1.2 | 0.2 ± 0.3 |
| PES + POBA (n = 4) | 0.7 ± 0.6 | 2.2 ± 1 | 1.7 ± 1.2 | 1.4 ± 1 | 1.7 ± 0.7 | 3.9 ± 0.2 | 1 ± 0.5 | 4 ± 0 | 1 ± 0.3 | 2.1 ± 0.7 | 0 ± 0 |
| ‐limus DES + PCB (n = 8) | 0.7 ± 0.7 | 1.6 ± 1.2 | 1.3 ± 1.1 | 1.1 ± 0.9 | 1.2 ± 1 | 3.6 ± 0.5 | 0.8 ± 0.4 | 3.9 ± 0.2 | 0.8 ± 0.8 | 0.5 ± 0.4 | 0 ± 0.1 |
| ‐limus DES + POBA (n = 8) | 1.1 ± 1 | 1.9 ± 1 | 1.2 ± 0.8 | 1.1 ± 0.7 | 1.5 ± 0.8 | 3.9 ± 0.2 | 0.5 ± 0.7 | 3.8 ± 0.5 | 0.3 ± 0.8 | 0.3 ± 0.8 | 0 ± 0.1 |
NS, not statistically significant.
Figure 5.
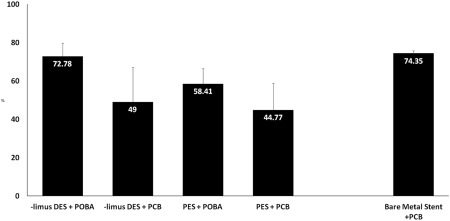
% area stenosis (mean and standard deviation) in subgroups by histomorphometry at day 60.
Figure 6.
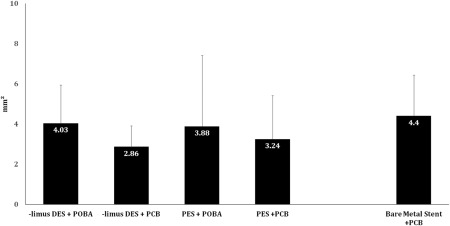
Comparison of NA (mm2) in subgroups at Day 60 termination by histomorphometry.
DISCUSSION
The Characteristics of Paclitaxel Distribution in ISR Setting
To our knowledge, this study is the first to characterize the drug distribution by a PCB technology at ISR circumstance. One of our main findings showed that following 30 seconds inflation of a PCB, the neointimal tissues displayed ∼18 times higher drug C max, and retained five times higher drug level than that in vessel wall tissues up to 30 days.
The mechanism of action of PCB in ISR is not completely clear and every PCB has its unique technology. All published pharmacokinetic data presented to date has been derived from computational models or experimental studies using normal vessels 11, 12, 13, 14. PCB showed a uniform drug distribution on a non‐stented vessel surface 15. Then, it is expected that underlying tissue growth or the presence of a stent may impact drug transfer and distribution pattern 16. The present study demonstrated that the drug was evenly distributed at the target vessel site, even with the stent struts underneath and that the drug preferentially deposited in the neointimal tissue (Fig. 2). These unique pharmacokinetic characteristics, presumably, are due to the fact that ISR lesions are rich in smooth muscle cells (SMC) having a high binding affinity for paclitaxel 17, 18. These data also further support a recent publication describing that the mechanism of action of PCB in non‐stented vessels is related to the deposition of paclitaxel particles on the surface of the vessel wall 18.
Biological Effects of PCB On Vascular Healing in DES‐ISR
Our study represents a new experimental study assessing the biological effects of PCB use in the DES‐ISR model. It is known that a therapeutic level of drug uptake and retention is a pre‐condition to effectively inhibit the neointimal growth. We believe that the dominant drug deposition and prolonged retention in the neointimal tissues showed in this study contribute to the efficacy (less neointima, less stenosis, and patent lumen) demonstrated by all the analytical methods used in this study.
Clinically, the safety and efficacy profile of PCB was originally tested in the setting of coronary BMS‐ISR 3, 19, 20. In PERVIDEO registry study, 6‐month follow‐up showed the safety and feasibility of lutonix PCB in BMS‐ISR, and a certain biological effect as indicated by very low LLL (unpublished data, presented at TCT 2010 by Laura Mauri, MD). Recently, several clinical studies have shown the clinical efficacy and safety of PCB also in coronary DES‐ISR 21, 22, 23.
An interesting finding is that by OCT, the effect on neointimal proliferation inhibition of PCB therapy seemed to be higher in the paclitaxel‐DES‐ISR group compared to the limus‐DES‐ISR group. This may be related to the incremental dose effect of paclitaxel on an already eluting permanent paclitaxel based stent. Although the similar trend was not shown in subgroup comparison by histology, the inconsistency was likely due to different segments of an uneven ISR lesion where OCT and histological values were obtained separately.
Overall all groups showed histological changes consistent with drug treatment either from delivery associated with the primary stent implantation or secondary balloon treatment. There was a similar degree of inflammatory infiltration observed regardless of whether the second drug was delivered at BMS‐ISR+PCB or DES‐ISR+PCB versus the first drug delivery at DES‐ISR+POBA. This suggests that the use of PCB in the presence of mature neointima do not seem to trigger a secondary inflammatory process following additional drug delivery. The direct drug effect on SMC proliferation (media hypocellularity) and fibrin deposition were more noticeable in the paclitaxel‐DES‐ISR+POBA (mainly in media) and in the paclitaxel‐DES‐ISR+PCB (in both neointima and media) groups whereas the BMS‐ISR+PCB group showed hypocellularity most notably in the neointima, consistent with the mechanism of drug delivery.
Study Limitation
A limitation of this pilot study is the small sample size tested in each DES subgroup. The ISR lesions obtained in the swine model used in this study lack the classic atherosclerotic components seen in humans. In addition, the study is limited to a relatively short follow‐up period in which complete healing has not been obtained. Nevertheless, the characterization of vascular drug distribution in ISR setting would contribute to our understanding of the mechanism action of PCB angioplasty. Moreover, the results obtained in this study support the safe use of this technology in this common clinical scenario despite the repeat drug delivery.
CONCLUSION
In conclusion, in DES‐ISR setting, the delivery of paclitaxel via PCB technology is safe and effective regardless the DES type treated. However, slight signs of delayed healing were seen in the PES‐ISR group when combined with additional PCB treatment. Paclitaxel uptake does not seem to be impacted despite the presence of metallic struts. A higher uptake and long term retention of paclitaxel in neointimal tissue suggests that neointimal deposition of paclitaxel plays an important role in clinical efficacy of this technology.
ACKNOWLEDGMENTS
The authors thank American Preclinical Service, Minneapolis, MN, US, for conducting the animal experiments, including interventions, imaging data collection and sample preparation. Dr. John Foley helped manuscript preparation.
Conflict of interest: Y.L. is an employee of Bard Lutonix. C.B. was a previous employee of Bard Lutonix.
REFERENCES
- 1. Alfonso F, Byrne RA, Rivero F, Kastrati A. Current treatment of in‐stent restenosis. J Am Coll Cardiol 2014;63:2659–2673. [DOI] [PubMed] [Google Scholar]
- 2. Cosgrave J, Melzi G, Corbett S, et al. Repeated drug‐eluting stent implantation for drug‐eluting stent restenosis: The same or a different stent. Am Heart J 2007;153:354–359. [DOI] [PubMed] [Google Scholar]
- 3. Joner M, Radke PW, Byrne RA, et al. Preclinical evaluation of a novel drug‐eluting balloon in an animal model of in‐stent stenosis. J Biomater Appl 2013;27:717–726. [DOI] [PubMed] [Google Scholar]
- 4. Byrne RA, Neumann F‐J, Mehilli J, et al. Paclitaxel‐eluting balloons, paclitaxel‐eluting stents, and balloon angioplasty in patients with restenosis after implantation of a drug‐eluting stent (ISAR‐DESIRE 3): A randomized, open‐label trial. Lancet 2013;381:461–467. [DOI] [PubMed] [Google Scholar]
- 5. Scheller B, Clever YP, Kelsch B, et al. Long‐term follow‐up after treatment of coronary in‐stent restenosis with a paclitaxel‐coated balloon catheter. JACC Cardiovasc Interv 2012;5:323–330. [DOI] [PubMed] [Google Scholar]
- 6. Habara S, Iwabuchi M, Inoue N, et al. A multicenter randomized comparison of paclitaxel‐coated balloon catheter with conventional balloon angioplasty in patients with bare‐metal stent restenosis and drug‐eluting stent restenosis. Am Heart J 2013;166:527–533. [DOI] [PubMed] [Google Scholar]
- 7. Rittger H, Brachmann J, Sinha A‐M, et al. A randomized, multicenter, single‐blinded trial comparing paclitaxel‐coated balloon angioplasty with plain balloon angioplasty in drug‐eluting stent restenosis: The PEPCAD‐DES study. J Am Coll Cardiol 2012;59:1377–1382. [DOI] [PubMed] [Google Scholar]
- 8. Hehrlein C, Dietz U, Kubica J, et al. Twelve‐month results of a paclitaxel releasing balloon in patients presenting with in‐stent restenosis First‐in‐Man (PEPPER) trial. Cardiovasc Revascularization Med Mol Interv 2012;13:260–264. [DOI] [PubMed] [Google Scholar]
- 9. Indermuehle A, Bahl R, Lansky AJ, et al. Drug‐eluting balloon angioplasty for in‐stent restenosis: A systematic review and meta‐analysis of randomized controlled trials. Heart Br Card Soc 2013;99:327–333. [DOI] [PubMed] [Google Scholar]
- 10. Schwartz RS, Edelman E, Virmani R, et al. Drug‐Eluting Stents in Preclinical Studies: Updated Consensus Recommendations for Preclinical Evaluation. Circ Cardiovasc Interv 2008;1:143–153. [DOI] [PMC free article] [PubMed] [Google Scholar]
- 11. Dommke C, Haase KK, Süselbeck T, et al. Local paclitaxel delivery after coronary stenting in an experimental animal model. Thromb Haemost 2007;98:674–680. [PubMed] [Google Scholar]
- 12. Kelsch B, Scheller B, Biedermann M, et al. Dose response to Paclitaxel‐coated balloon catheters in the porcine coronary overstretch and stent implantation model. Invest Radiol 2011;46:255–263. [DOI] [PubMed] [Google Scholar]
- 13. Speck U, Cremers B, Kelsch B, et al. Do pharmacokinetics explain persistent restenosis inhibition by a single dose of paclitaxel? Circ Cardiovasc Interv 2012;5:392–400. [DOI] [PubMed] [Google Scholar]
- 14. Buszman PP, Tellez A, Afari ME, et al. Tissue uptake, distribution, and healing response after delivery of paclitaxel via second‐generation iopromide‐based balloon coating: A comparison with the first‐generation technology in the iliofemoral porcine model. JACC Cardiovasc Interv 2013;6:883–890. [DOI] [PubMed] [Google Scholar]
- 15. Scheller B, Speck U, Böhm M. Prevention of restenosis: Is angioplasty the answer? Heart Br Card Soc 2007;93:539–541. [DOI] [PMC free article] [PubMed] [Google Scholar]
- 16. Abraham JP, Gorman JM, Sparrow EM, et al. A mass transfer model of temporal drug deposition in artery walls. Int J Heat Mass Transf 2013;58:632–638. [Google Scholar]
- 17. Byrne RA, Joner M, Tada T, Kastrati A. Restenosis in bare metal and drug‐eluting stents: Distinct mechanistic insights from histopathology and optical intravascular imaging. Minerva Cardioangiol 2012;60:473–489. [PubMed] [Google Scholar]
- 18. Granada JF, Stenoien M, Buszman PP, et al. Mechanisms of tissue uptake and retention of paclitaxel‐coated balloons: Impact on neointimal proliferation and healing. Open Heart 2014;1:e000117–e000117 [DOI] [PMC free article] [PubMed] [Google Scholar]
- 19. Kleber FX, Rittger H, Bonaventura K, et al. Drug‐coated balloons for treatment of coronary artery disease: Updated recommendations from a consensus group. Clin Res Cardiol 2013;102:785–797. [DOI] [PubMed] [Google Scholar]
- 20. Stella PR, Belkacemi A, Waksman R, et al. The Valentines Trial: Results of the first one week worldwide multicentre enrolment trial, evaluating the real world usage of the second generation DIOR paclitaxel drug‐eluting balloon for in‐stent restenosis treatment. EuroIntervention 2011;7:705–710. [DOI] [PubMed] [Google Scholar]
- 21. Loh JP, Stella PR, Sangiorgi G, et al. Paclitaxel‐coated balloon for the treatment of drug‐eluting stent restenosis: Subanalysis results from the Valentines I trial. Cardiovasc Revasc Med 2014;15:23–28. [DOI] [PubMed] [Google Scholar]
- 22. Xu B, Gao R, Wang J, et al, PEPCAD China ISR Trial Investigators. A prospective, multicenter, randomized trial of paclitaxel‐coated balloon versus paclitaxel‐eluting stent for the treatment of drug‐eluting stent in‐stent restenosis: Results from the PEPCAD China ISR trial. JACC Cardiovasc Interv 2014;7:204–211. [DOI] [PubMed] [Google Scholar]
- 23. Almalla M, Schröder J, Pross V, Marx N, Hoffmann R. Paclitaxel‐eluting balloon versus everolimus‐eluting stent for treatment of drug‐eluting stent restenosis. Catheter Cardiovasc Interv 2014;83:881–887. [DOI] [PubMed] [Google Scholar]