
Figure 2.
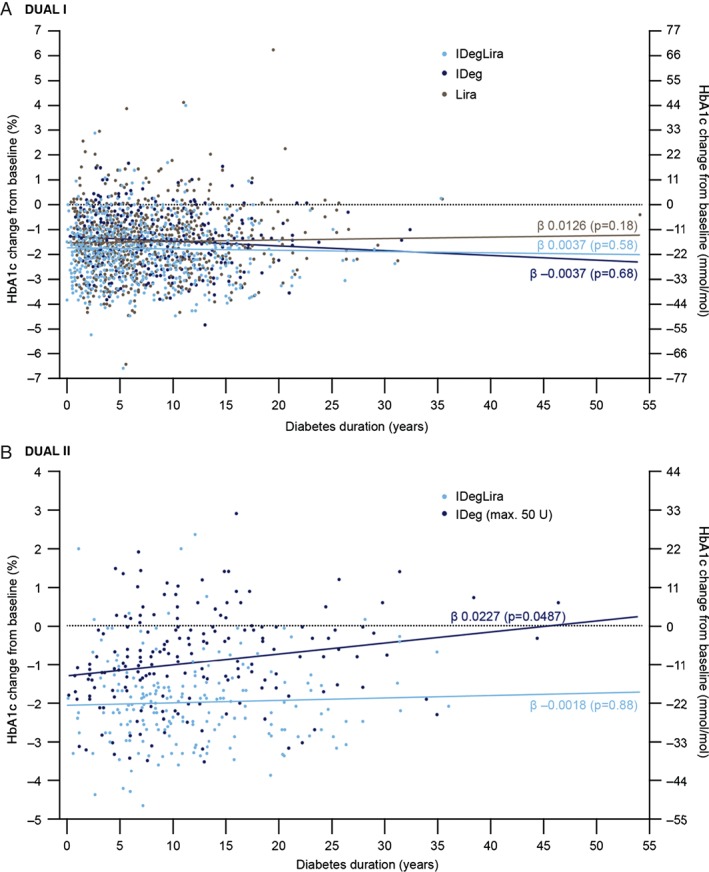
Change in glycated haemoglobin (HbA1c; y‐axis) in relation to duration of diabetes (x‐axis) in DUAL I (A) and DUAL II (B). The fit line for each treatment is least squares mean. The regression analysis estimates the linear relationship between disease duration and change in HbA1c from baseline. The regression coefficient (β) is the slope of the line given by the relationship, and the reported p value corresponds to the test of whether the slope of the line is equal to 0, indicating no relationship between the two variables. IDeg, insulin degludec; IDegLira; insulin degludec/liraglutide combination; Lira, liraglutide. DUAL I regression coefficients (β) ± standard error of the mean (s.e.m.): IDegLira 0.0037 ± 0.0067 (p = 0.58), IDeg −0.0037 ± 0.0091 (p = 0.68), liraglutide 0.0126 ± 0.0094 (p = 0.18). DUAL II regression coefficients (β) ± s.e.m.: IDegLira −0.0018 ± 0.0117 (p = 0.88), IDeg 0.0227 ± 0.0114 (p = 0.0487).