
Figure 4.
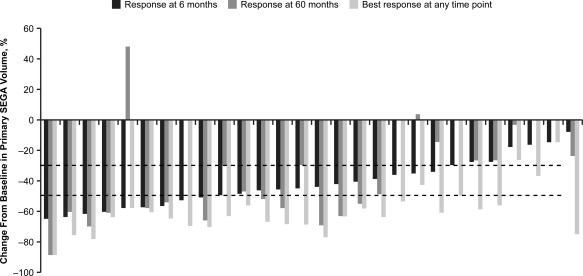
Comparison of primary subependymal giant cell astrocytoma (SEGA) response in individual patients by independent central radiology review at 6 months and 60 months, and the best response at any time point. The dotted lines denote clinically relevant cutoffs of ≥30% and ≥50% reductions from baseline in primary SEGA volume. Data are arranged by decreasing response at 6 months. Best response and 6‐month data are shown for all 28 patients; 60‐month data are shown for the 23 patients with centrally reviewed SEGA scans at that time point.