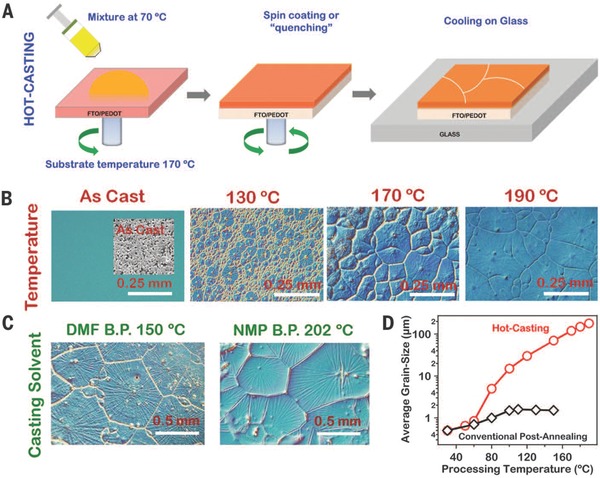
Figure 4.

a) Schematic diagram of hot‐casting process. b) Optical images (resolution: 0.25 mm) of as‐casted perovskite layer under different substrate temperature (130 °C, 170 °C and 190 °C). c) Optical images of films with additives of DMF (boiling point: 150 °C) and NMP (boiling point: 202 °C). d) Average grain size as a function of processing temperature by hot‐casting method (red curve) and traditionally annealing method (black curve). Reproduced with permission.34 Copyright 2015, American Association for the Advancement of Science.
