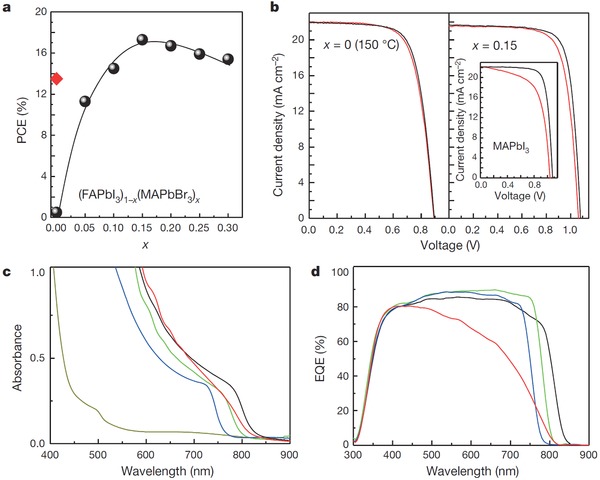
Figure 5.

a) The PCE as a function of x (varied from 0 to 0.3) in (FAPbI3)1–x (MAPbBr3)x‐based solar cells (100 °C annealing); the red point is the PCE of initial solar cell only with perovskite FAPbI3 (150 °C annealing). b) J–V curves of (FAPbI3)1–x (MAPbBr3)x‐based devices with x = 0 (150 °C annealing), 0.15 and referential MAPbI3 device. c) UV–vis absorption spectra corresponding to x = 0 (dark yellow curve), 0.05 (red curve), 0.15 (green curve) and 0.25 (blue curve); black curve represents FAPbI3 (150 °C annealing) and d) correlated EQE spectra. Reproduced with permission.37 Copyright 2015, Nature Publishing Group.
