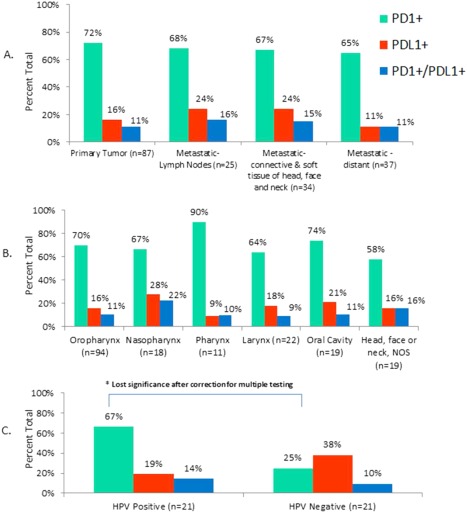
Figure 4.

Percent positive expression of programmed death‐1 (PD‐1) and programmed death ligand‐1 (PDL1), according to (A) disease state, (B) primary site location, and (C) human papillomavirus (HPV) status. Green bars represent PD1‐positive expression on tumor infiltrating lymphocytes; red bars represent PDL1‐positive expression in tumor cells and blue bars represent concurrent PD1/PDL1‐positivity. (A) Percent expression according to disease stage of specimen used for profiling. (B) Percent expression according to primary tumor site location. (C). Percent expression according to HPV status.
