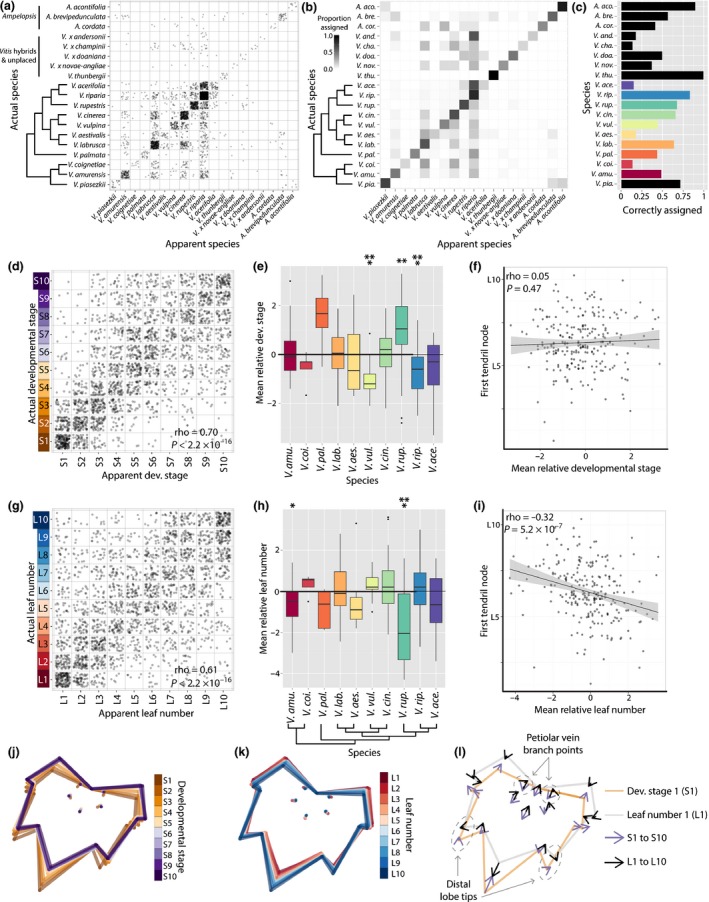
Figure 4.

Species, developmental stage and leaf number can be predicted independently of each other. (a) Confusion matrix resulting from the prediction of species identity using a linear discriminant analysis (LDA). The panel should be read from left to right: for each species indicated on the left, leaves appeared to be derived from the apparent species indicated on the bottom. Developmental stage and leaf number were not considered in the prediction. (b) Same as (a), except the apparent species assigned to each actual species has been converted into a proportion. Proportion totals equal one adding from left to right. (c) The proportion of correctly assigned leaves for each species. (d) Similar to (a), actual developmental stage (left) and apparent developmental stage (bottom), predicted without species or leaf number information. (e) Relative developmental stage values (apparent – actual developmental stage) averaged for vines from each species. Significant deviations from zero are indicated: *, P < 0.05; **, P < 0.01; ***, P < 0.001. Median and first and third quartiles represented by the box; whiskers extend to the most extreme value within 1.5 times the interquartile range. (f) Correlation between mean relative developmental stage of vines and first tendril node. The fitted linear model is drawn. (g–i) Same as (d–f), but for leaf number. Note the significant correlation between the first tendril node and relative leaf number (i), not seen for developmental stage (f). (j, k) Latent shape attributes defining developmental stage (j) and leaf number (k) indicated with average leaf shapes. (l) Comparison of changes in latent shape attributes across developmental stage (orange outline, S1; purple arrow, S1 to S10) and leaf number (gray outline, L1; black arrow, L1 to L10). Note the non‐inverse relationship between developmental stage and leaf number changes in the distal lobe tips and petiolar vein branch points (indicated).
