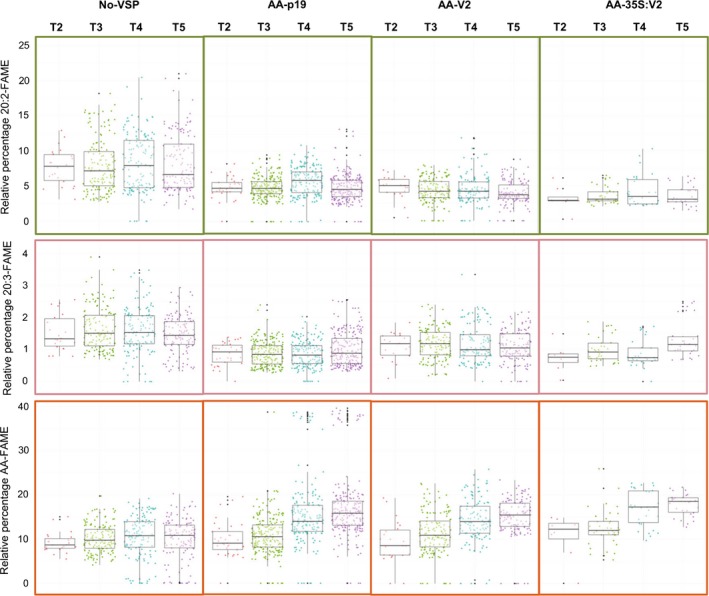
Figure 3.

Relative percentages of 20:2‐FAME, 20:3‐FAME and AA‐FAME extracted from T2–T5 seeds of transgenic A. thaliana. Box‐whisker plot analysis of a large population of transgenic A. thaliana expressing the constructs described in Figure 2. Relative percentages of 20:2, 20:3 and AA shown and dot points refer to independent transformation events in T2 and their respective progenies in T3–T5. Points outside of the whiskers are not included in the calculation of median or quartiles.
