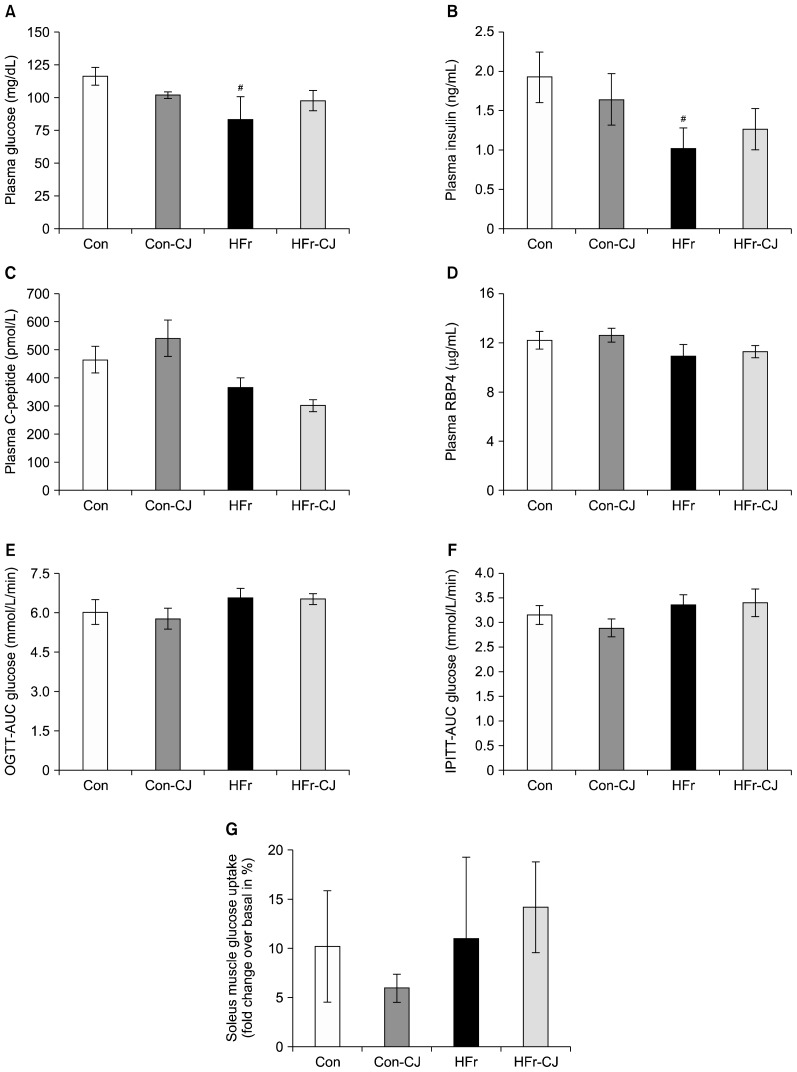
Fig. 2.
Impacts of carrot juice on insulin sensitivity markers. Results are expressed as means±SE of 7~8 rats, except for muscle glucose uptake, 4 rats from each group. Plasma glucose, insulin, plasma C-peptide, and retinol-binding protein 4 (RBP4) levels, respectively (A~D). Area under curve (AUC) of glucose for respective oral glucose tolerance test (OGTT) (E) and intra-peritoneal insulin tolerance test (IPITT) (F). Soleus muscle insulin-stimulated glucose uptake (fold change in % over basal glucose uptake) (G). Data were analyzed by one way ANOVA with post-hoc least significant difference test. #Significantly different at P≤0.05 compared between control and high fructose group. Con, control diet; Con-CJ, control diet with carrot juice; HFr, high fructose diet; HFr-CJ, high fructose diet with carrot juice.

